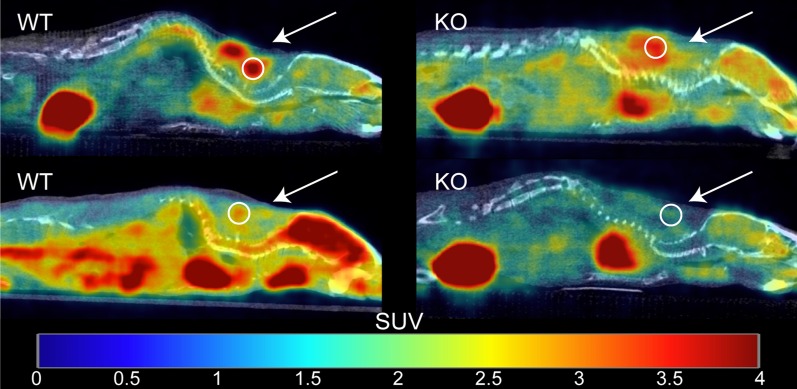
Fig. 3.
Example of fused [18F]FDG PET/CT images acquired from unfasted male WT and KO mice after NE injection. Images are displayed on the same SUV scale on a sagittal view. For each mouse, a 5 mm2 ROI (circle) was drawn around the region of maximum intensity within interscapular BAT (arrow), and the corresponding SUVpeak was calculated. Displayed on the left column are two different WT mice that present very different glucose uptake. Represented on the right column are two KO mice with very different [18F]FDG uptake

