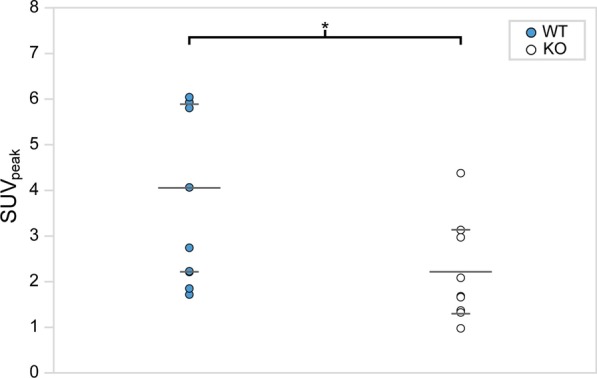
Fig. 6.

[18F]FDG SUVpeak within interscapular BAT of fasted male mice after NE injection. SUVpeak is plotted for each genotype. Means (short) and standard deviations (long) for each group are represented by horizontal gray bars. With fasting, a statistically significant difference between male WT (blue) and KO (white) SUVpeak was observed (p = 0.03). However, the WT and KO SUVpeak ranges still overlapped and a clear SUV threshold to differentiate animals with very different thermogenic capacity cannot be established, despite animal fasting
