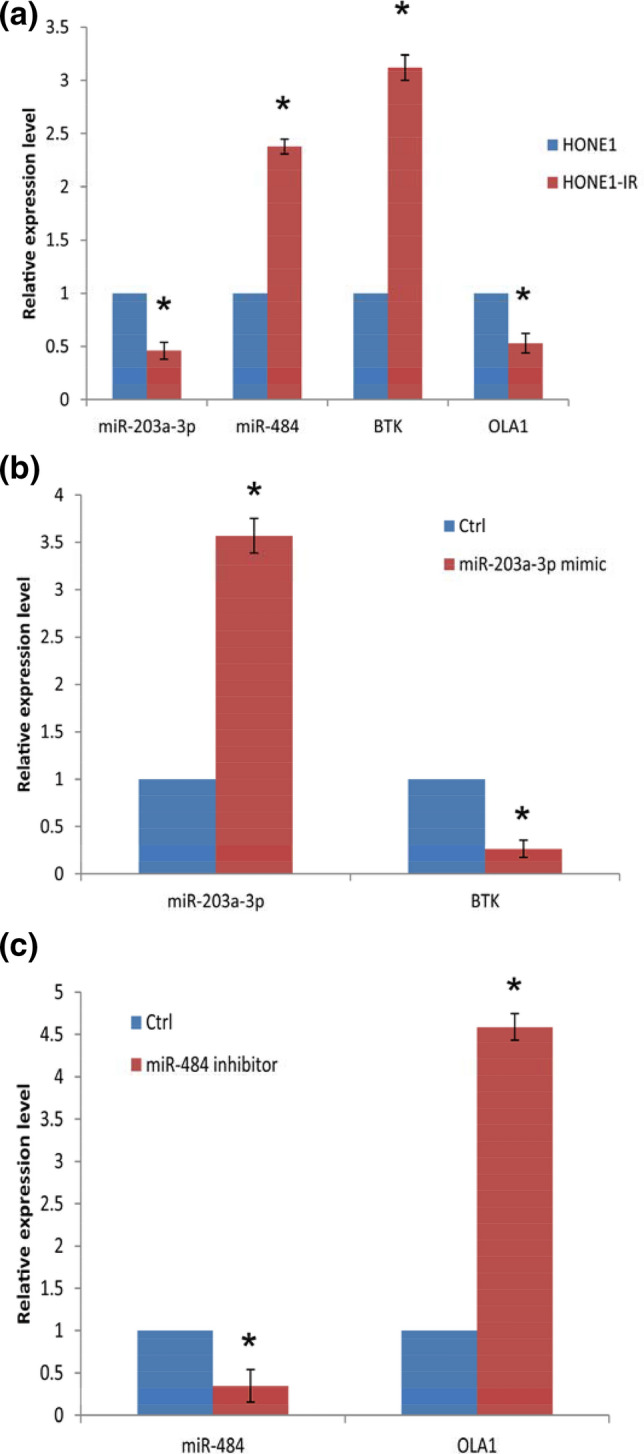
Fig. 4.

a The expression levels of the candidate miRNAs and mRNAs in HONE1 and HONE1-IR cells, as determined by qRT-PCR (P < 0.05, HONE1-IR vs HONE1 in the four comparisons, respectively). b The expression levels of miR-203a-3p/BTK mRNA in HONE1-IR cells with or without miR-203a-3p mimic administration (qRT-PCR; P < 0.05, miR-203a-3p mimic vs controls). c The expression levels of miR-484/OLA1 mRNA in HONE1-IR cells with or without miR-484 inhibitor administration (qRT-PCR; P < 0.05, miR-484 inhibitor vs controls)
