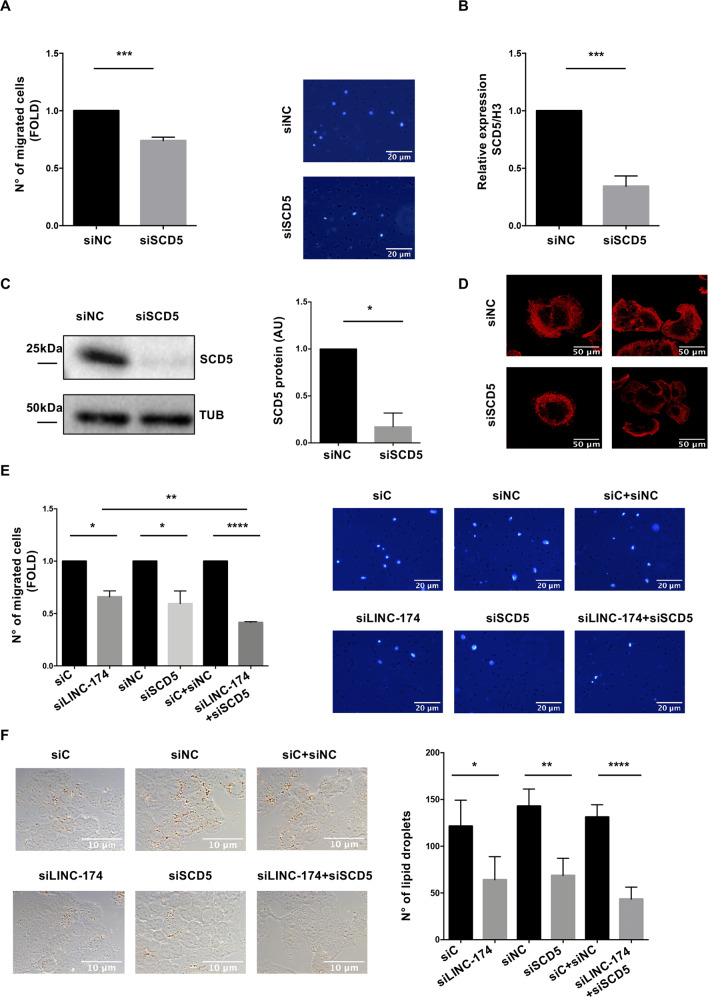
Fig. 5. Silencing of SCD5 impacts on migration and lipid droplets content of TC1889 cells.
A Transwell migration analysis to evaluate differences in motility upon SCD5 silencing (n = 3, p value = 0.0005) in TC1889 cells. Migration has been normalized over cell numbers in the indicated conditions. B RT-qPCR and C western blot analysis to verify silencing of SCD5 at transcript (n = 3, p value = 0.0003) and protein (n = 3, p value = 0.035) levels. D Confocal microscopy upon SCD5 silencing for 72 h after staining with phalloidine. E Transwell migration assay after 72 h of double or single depletion of LINC00174 and/or SCD5. Migration has been normalized over cell numbers in the indicated conditions. F Oil red assay for lipid droplets counting in the same conditions as in (E). Quantification of lipid droplets by imageJ software. Significant p-values are indicated as *P < 0.05; **P < 0.005; ***P < 0.0005; ****P < 0.00005.

