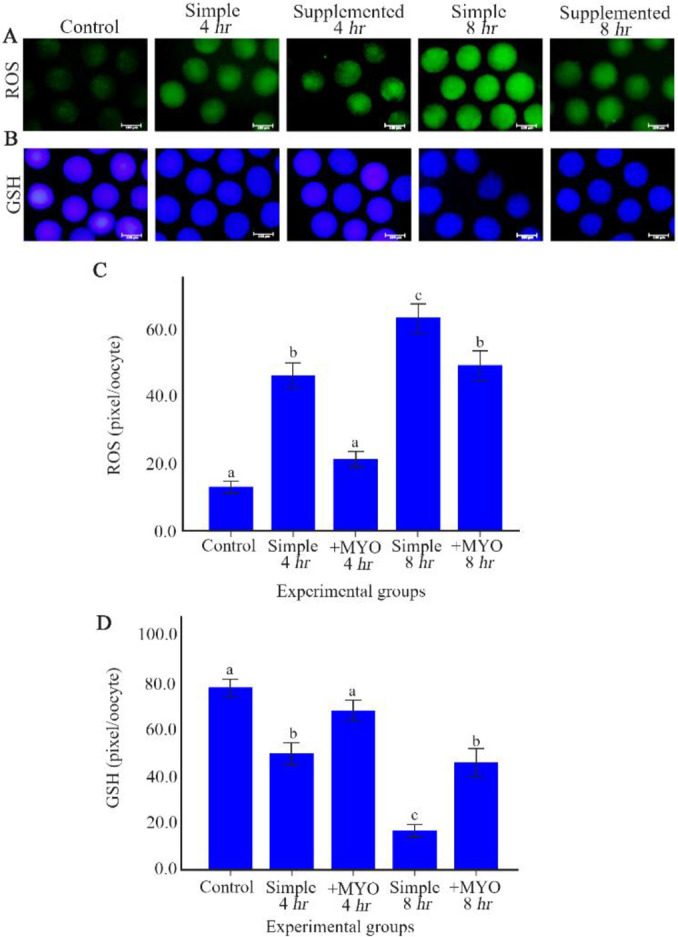
Figure 1.

The effect of preincubation time and myo-inositol supplementation on the ROS and GSH levels in mouse MII oocytes. MII oocytes preincubated in each simple and supplemented medium for 0, 4 and 8 hr were dyed with (A) H2DCFDA and (B) Cell Tracker Blue to detect ROS and GSH levels, respectively. Scale bar indicates 100 μm. (C) The fluorescent intensity of MII oocytes stained by H2DCFDA and (D) Cell Tracker Blue. Fluorescent intensities of each stained oocyte were quantified with Image J software (ANOVA, p<0.001; Tukey’s post hoc, p<0.001)
