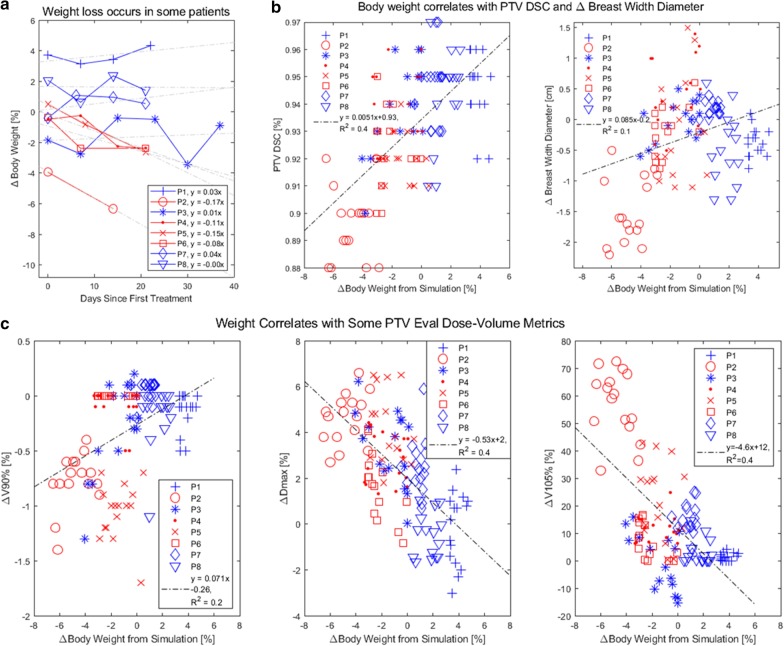
Fig. 5.
Body weight correlates with DSC, BWD, and PTV dose homogeneity and hotspot metrics. Data from patients who consistently lost weight over the course of the treatment are denoted in red (P2, P4, P5, and P6), while others are denoted blue. Linear fits (dotted lines) with equations and regression coefficient are also shown. a Some patients were susceptible to weight loss, with one patient (P2) losing 4% body weight from simulation even before treatment began. b DSC and BWD correlated to body weight. c Breast PTV Eval ΔV90%, ΔDmax, and ΔV105% (Δ = change from planned) correlates well with Δ body weight. Weight loss correlated to decreased PTV V90%, increased Dmax, and increased V105%, highlighting its crucial role in target coverage and reduction of hotspot

