
FIGURE 1.
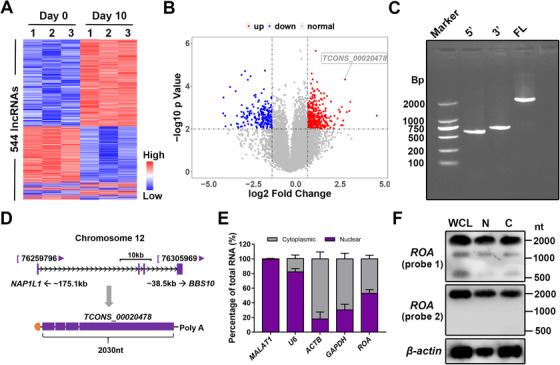
TCONS_00020478 was selected by microarray. A, Cluster heatmap showing lncRNAs with an expression fold change ≥ 2 from microarray data on days 0 and 10 of MSC osteogenesis (n = 3, P < .01). B, Volcano plot of 20 703 analyzed lncRNAs. ROA (TCONS_00020478) is highlighted in the label. C, Electrophoresis of fragments amplified by RACE. 5′, 5′‐RACE; 3′, 3′‐RACE; FL, full length. D, Schematic annotation of ROA. E, Percentage of ROA distribution detected by qRT‐PCR after cell fractionation. MALAT1 and U6 served as positive nuclear controls, and GAPDH and ACTB served as positive cytoplasmic controls. F, Northern blot of ROA showing the transcript length and distribution of ROA in the cytoplasmic and nuclear extracts. Probe 1 targets at the sequence close to the 5′ end and probe 2 targets at the sequence close to 3′ end of ROA. WCL, whole cell lysate; C, cytoplasmic; N, nuclear