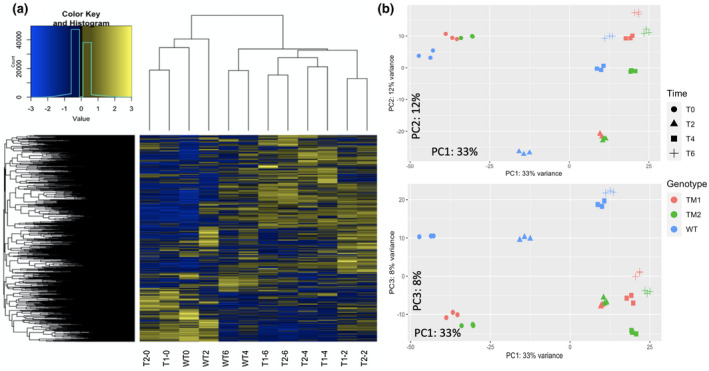
FIGURE 3.

Transcriptome comparisons. Hierarchical clustering was used to generate a heatmap of transcriptomes, which represent mean expression levels of the three replicates per line at each time point. (T1 = atx1,3,4 TM1, T2 = atx1,3,4 TM2). PCA was completed using the DeSeq2 package, and results for the first three principal components are shown. (Data File S3 contains the code used to generate the PCA plots).
