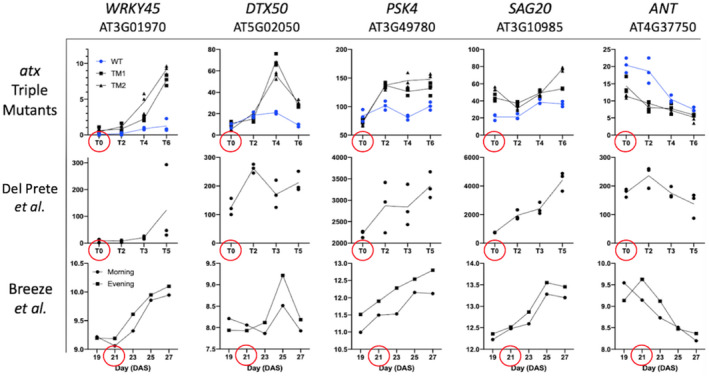
FIGURE 5.

Examples of BAG expression across experiments. Raw mean data from each experiment were used to generate graphs in GraphPad PRISM. Data from the atx1,3,4 TM and Del Prete et al. experiments represent FPKM from RNA‐seq, while Breeze et al. is Lowess normalized averaged (4 reps) signals in log space from a microarray experiment. Red circles indicate the time of phase transition in each experiment (bolting/flowering time for the atx triple mutants and Breeze et al., and time of photoperiod transition for Del Prete et al). Samples from plants undergoing the vegetative‐reproductive transition are shown in black while vegetative control plants are shown in blue.
