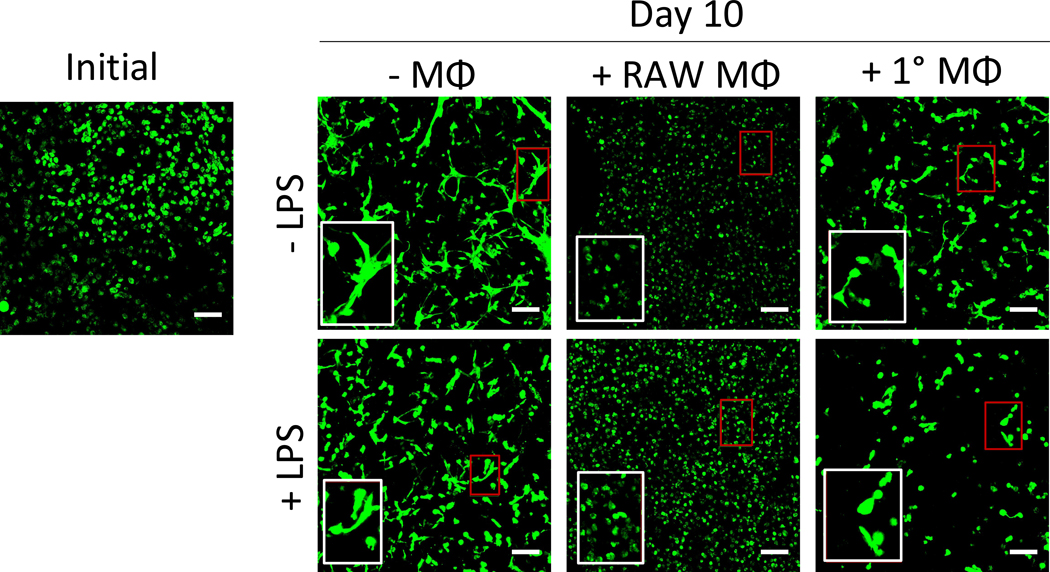
Figure 4 –
The effects of macrophages on MC3T3-E1 cell morphology. Representative confocal microscopy images of hydrogels immediately after encapsulation and after 10 days of culture. Cells were stained using calcein AM to visualize morphology. Red box indicates region of interest, white box shows ROI at 2x magnification. Scale bar = 100 μm.

