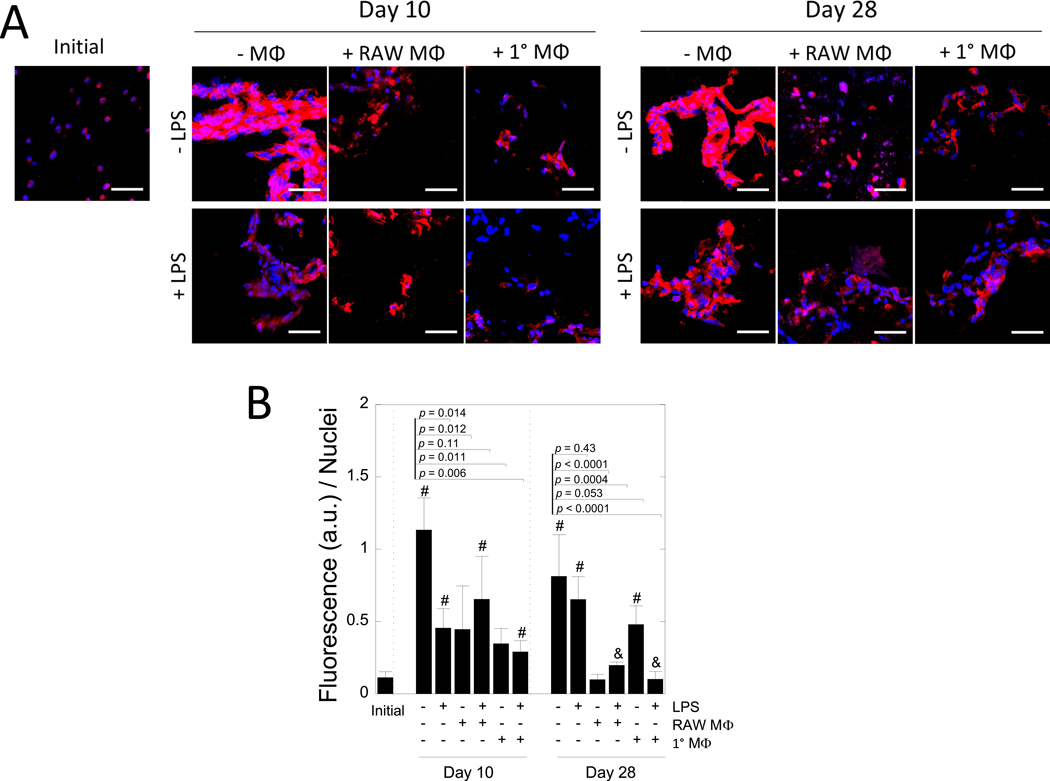
Figure 5 –
The effect of macrophages on collagen I deposition by MC3T3-E1 cells. A) Representative confocal microscopy images of hydrogels after 0, 10, and 28 days of culture. Sections were stained for anti-collagen I (red) and counterstained with DAPI for cell nuclei (blue). Scale bar = 50 μm. B) Semi-quantification of the fluorescence (arbitrary units) normalized to the number of nuclei per image. Data are shown as mean (n=3–4) with standard deviation as error bars. P-values displayed are for pairwise comparisons between the unstimulated mono-culture and each treatment condition at each time point. “#” denotes statistical significance (p < 0.05) as compared to day 0, “&” denotes statistical significance (p < 0.05) as compared to corresponding condition at day 10.

