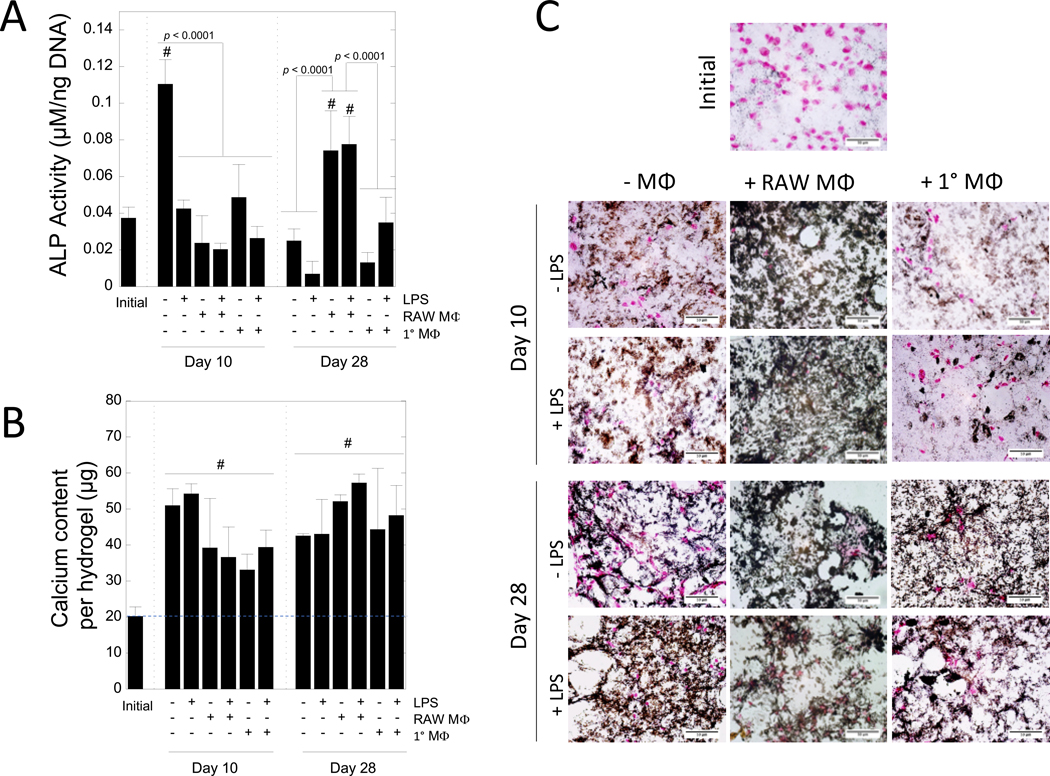
Figure 6 –
The effects of macrophages on ALP activity and mineralization in MC3T3-E1-laden PEG hydrogels. A) ALP activity after 0, 10, and 28 days of culture. B) Total calcium content in hydrogels after 0, 10, and 28 days of culture. Blue dashed line indicates the mean calcium level at day 0, which provides a baseline for comparison. Data for A and B shown as mean (n = 3) with standard deviation as error bars. “#” denotes statistical significance (p < 0.05) as compared to day 0. C) Representative microscopy images of hydrogels fixed after 0, 10, and 28 days of culture and stained for von Kossa mineralization (black) and counterstained with nuclear fast red for nuclei (pink). Scale bar = 100 μm.

