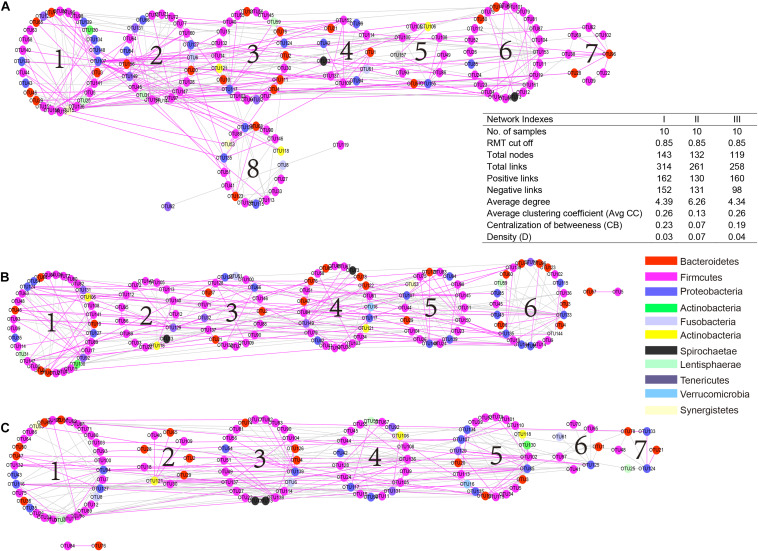
FIGURE 6.
Comparison of rumen bacteria networks during the regreen (A), grassy (B), and withering periods (C). A highly positive correlation is described by pink color, whereas highly negative correlation by green color. Higher average degree (avg k) and density (D) mean a more complex network. A lower average clustering coefficient (avgCC) indicate that bacterial network is mainly composed of relatively isolated nodes. A low level centralization betweenness (CB) signifies a similar bacteria status and more community stability of rumen bacteria. The serial number indicates the number of modules in each group.

