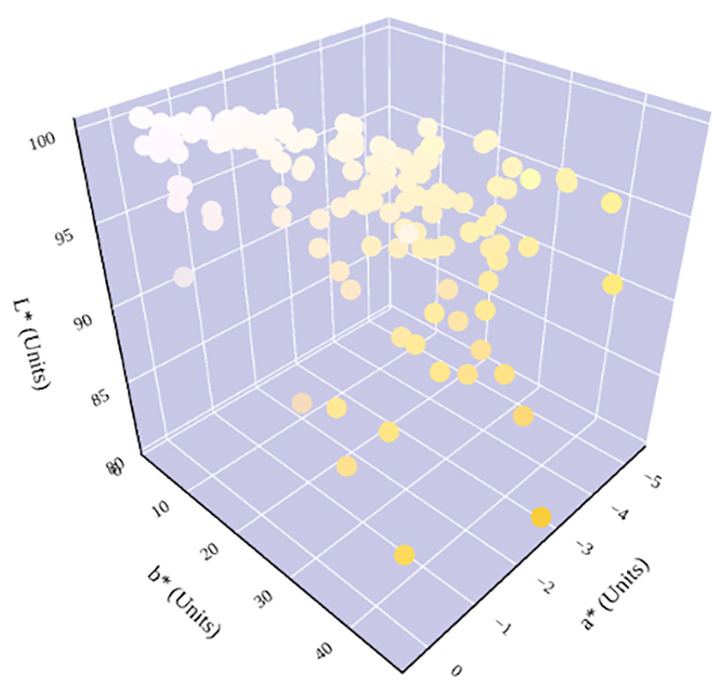
Figure 6.
Hydration status significantly determines urine color in the three-dimensional CIE L*a*b* color space. An increase in dehydration results in an increase in b* and a decrease in L*. The relationship between hydration status and a* is parabolic. A notable shift in a* trend occurs at ~600 mmol/kg, which has previously been identified as being in the cutoff range for distinguishing between whole-body euhydration and dehydration (4, 17–19).

