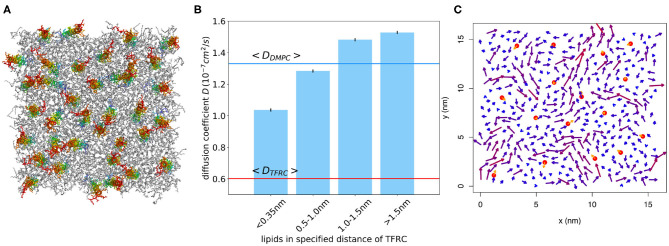
Figure 11.
(A) Snapshot of atomistic MD simulation of a DMPC/TFRC system at 6 mol% TFRC after 500 ns equilibration (lipids in gray, peptides colored). (B) Lipid diffusion coefficient for different distances from the peptide for the system at 2 mol% TFRC. The diffusion coefficient was determined from time windows of 10 ns length. For comparison, the average lipid and TFRC diffusion coefficients are displayed as blue and red horizontal lines, respectively. (C) The arrows represent the peptide (orange) and lipid (blueish) average molecular center of mass velocity for a selected time window of 10 ns, respectively. Lipids in the vicinity of a peptide move considerably slower on average.

