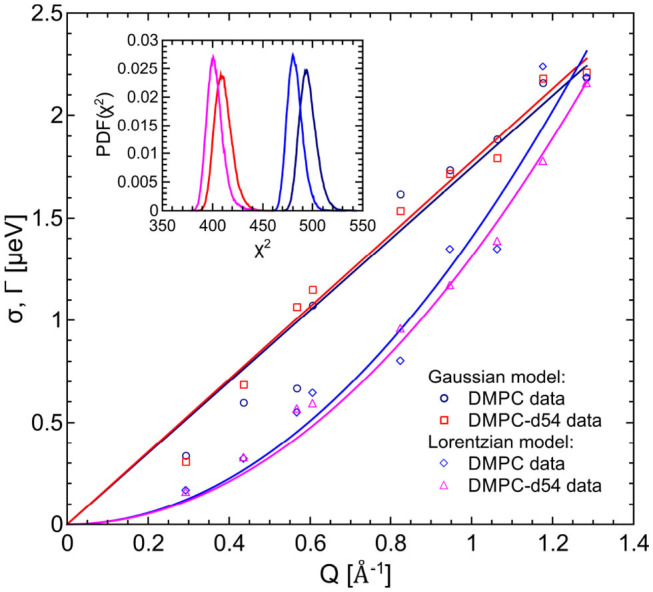
Figure 5.

PDFs as a function of χ2 for the fit model of the respective DMPC (blue) and DMPC-d54 (red) data. The diffusion (Lorentzian) model better represents the long-range lipid dynamics which can be seen by the PDF maxima at smaller χ2-values. Furthermore, the standard deviations and HWHM are plotted as functions of Q.
