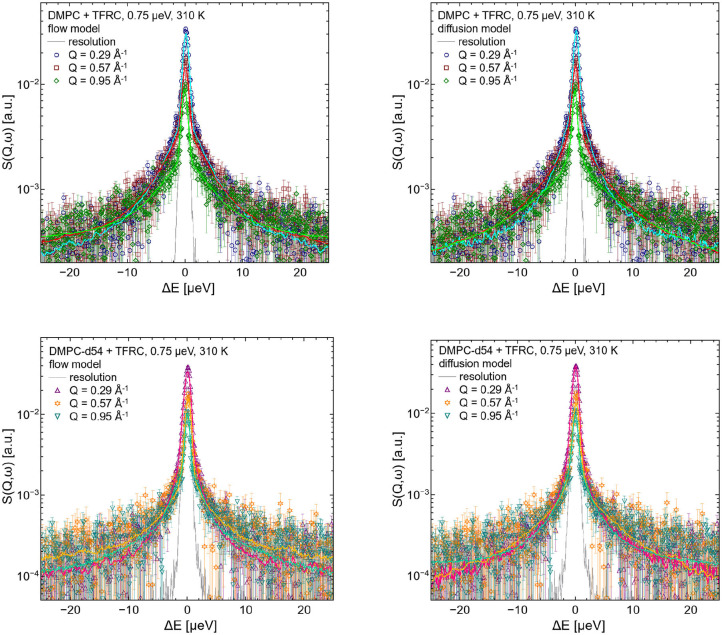
Figure 7.
QENS spectra of DMPC/TFRC LUV dispersions for Q = 0.29 Å−1, Q = 0.57 Å−1, and Q = 0.95 Å−1. In the left hand figures, the DMPC/TFRC LUV data (colored symbols) are displayed including the best fits of the flow model (colored lines, top: DMPC, bottom: DMPC-d54). In the right hand figure the same data and corresponding best fits of the diffusion model are visualized. The instrumental resolution is plotted as gray line in all panels.

