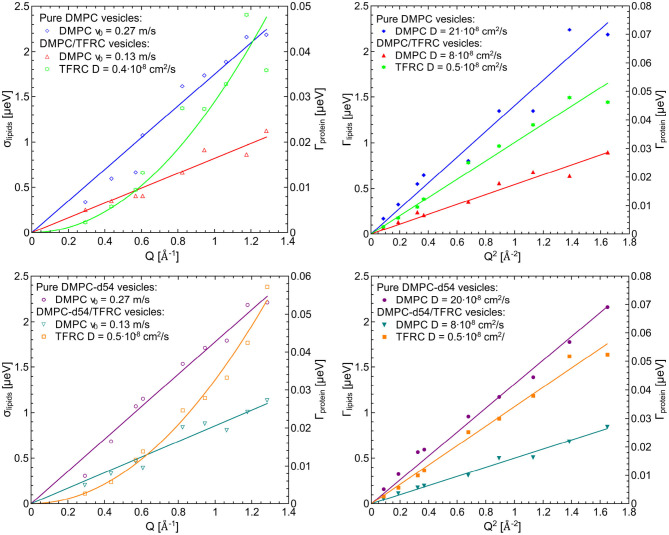
Figure 8.
Left figures (lipid flow model): σ-values for the lipid flow motion resulting from QENS data of pure DMPC LUVs and DMPC/TFRC LUVs (top) as well as DMPC-d54 LUVs and DMPC-d54/TFRC LUVs (bottom) and Γ-values of the diffusive motion of the TFRC peptide sequence (green and orange curves, right scale) as a function of Q, right figures (lipid diffusion model): Γ-values for the lipid and the peptide, respectively, of the same samples as a function of Q2.

