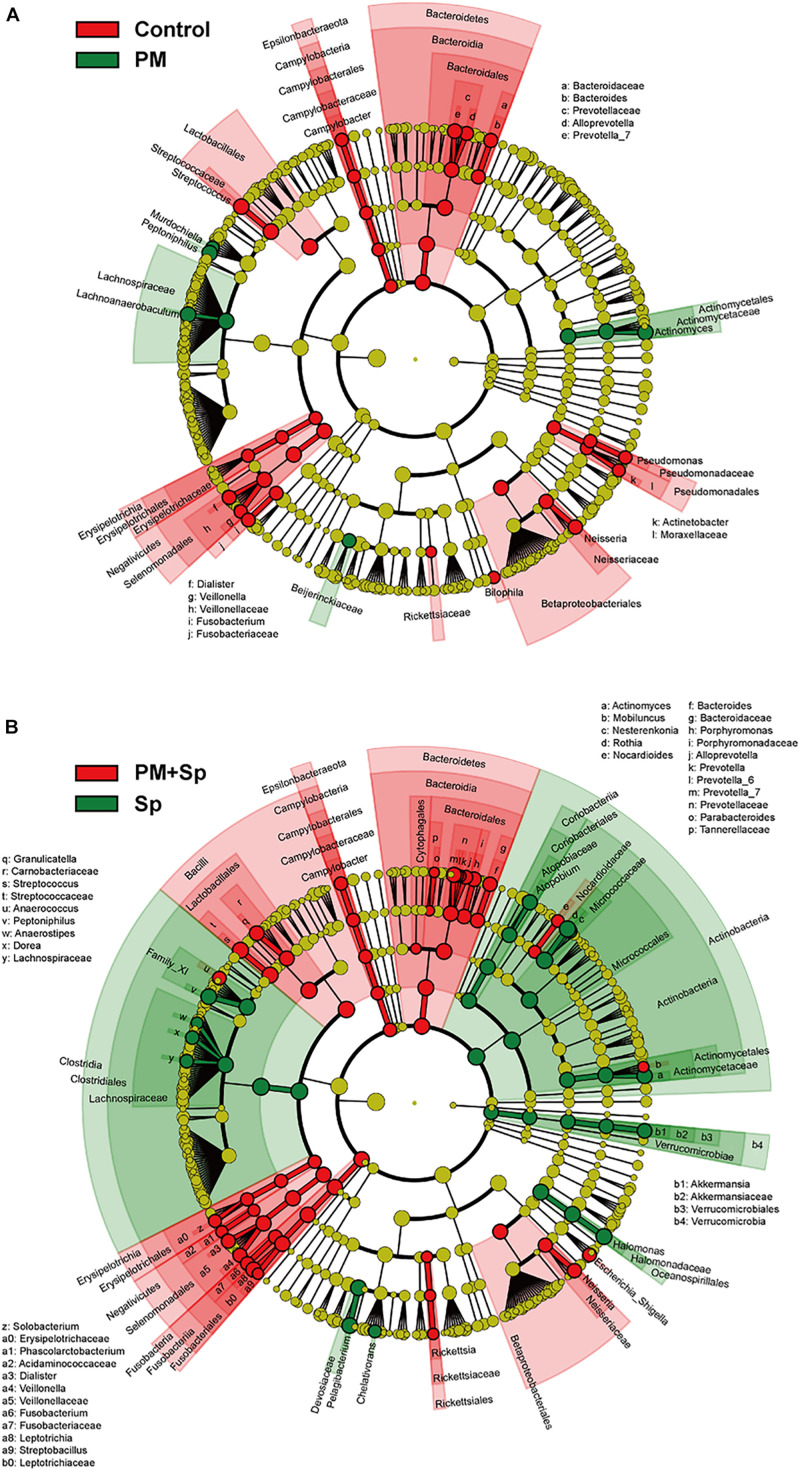
FIGURE 6.
Circular taxonomic and phylogenetic trees of microbiota diversity. Comparison of the taxonomy for the PM2.5-exposed in uninfected and pneumococcus-infected mice. The taxonomy was analyzed and performed as cladogram. Compared the effect of PM2.5 altered microbiota composition in panels (A) control and (B) pneumococcus-infected (Sp) mice. The relative color represented the more abundance bacterial taxonomy in each group.

