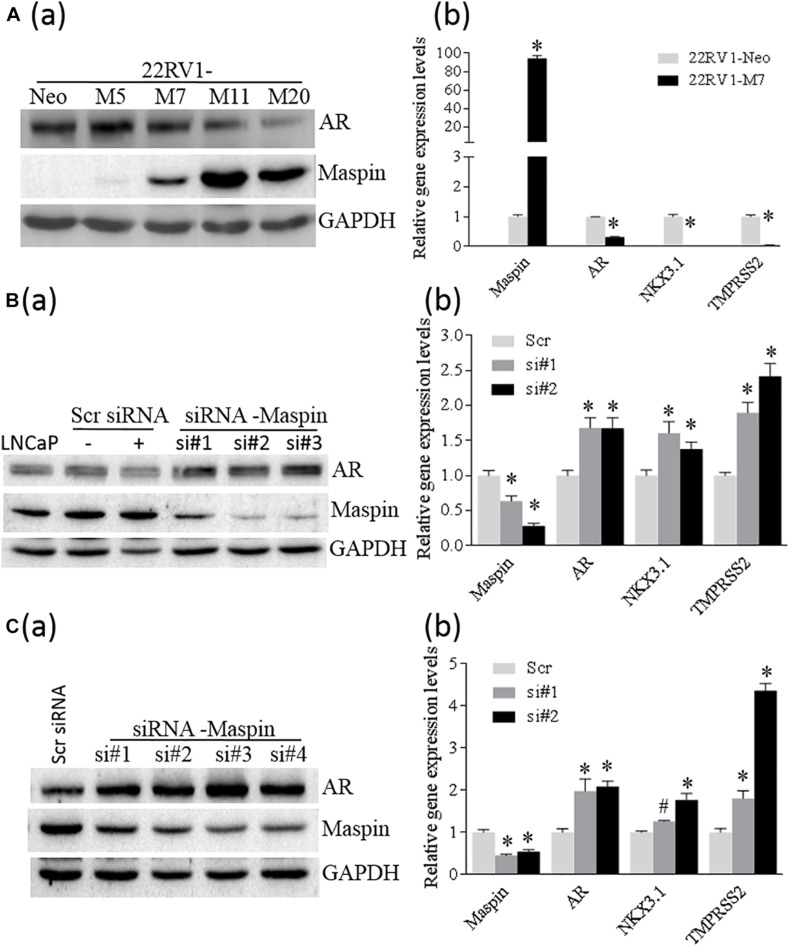
FIGURE 3.
Maspin repressed the expression of AR. (A) Overexpression of maspin in prostate cancer 22RV1 cell was conducted by ectopic recombinant maspin gene transfection as described in the section of Materials and Methods. The cells transfected with empty vector was used as Neo control. Then western blot was utilized to exam the expression of maspin, AR, and internal loading control of GAPDH in clone cells (a). Meanwhile, real-time PCR was used to evaluate the relative mRNA level of maspin, AR, NKX3.1, and TMPRSS2. The data are presented as an average of three repeats (b). (B) Prostate cancer LNCaP cells were transiently transfected with maspin siRNA as described in the section of Materials and Methods. The cells transfected with scramble RNA or solution vehicle were used as controls. Then the expression of maspin, AR, and internal loading control of GAPDH in clone cells was analyzed by WB. Three of maspin downregulated clones were designated as si#1, si#2, and si#3 (a). Meanwhile, qRT-PCR was used to evaluate the relative mRNA level of maspin, AR, NKX3.1, and TMPRSS2 in si#1, si#2, and Scr control after normalization with internal GAPDH mRNA. The data are presented as an average of three repeats (b). (C) The engineered PC3-AR18 cell clone with AR overexpression was established as described in the section of Materials and Methods. Then PC3-AR18 was transiently transfected with maspin siRNA as also described in the section of Materials and Methods. The cells transfected with scramble RNA was used as a control. Then the expression of maspin, AR, and internal loading control of GAPDH in clones was analyzed by WB. Four of maspin downregulated clones were designated as si#1, si#2, si#3, and si#4 (a). Meanwhile, real-time PCR was used to evaluate the relative mRNA level of maspin, AR, NKX3.1, and TMPRSS2 in si#1, si#2, and Scr control after normalization with internal GAPDH mRNA. The data are presented as an average of three repeats (b). The bars represent the SE The p values were obtained by one-tailed matched pair Student’s t tests (*compared with Neo group, p < 0.001).

