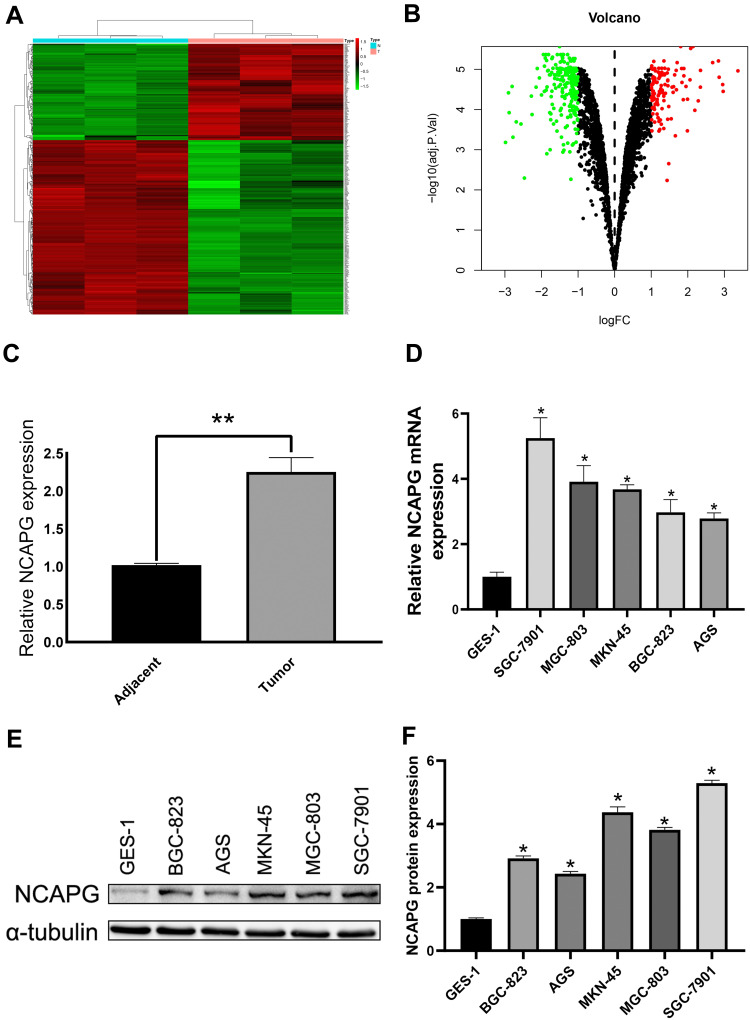
Figure 1.
NCAPG overexpression in cardia adenocarcinoma (CA) tumor cells. (A) Heat map of differential genes in CA tumor. (B) Volcano map of the differential genes in CA tumor. (C) All the CA tumor samples showed NCAPG overexpression. **Indicates P < 0.01. (D–F) NCAPG overexpression in CA tumor cells as per Western blot and qRT-PCR analysis. The mean ± SEM of three independent experiments was denoted using a bar. *Indicates P < 0.05.

