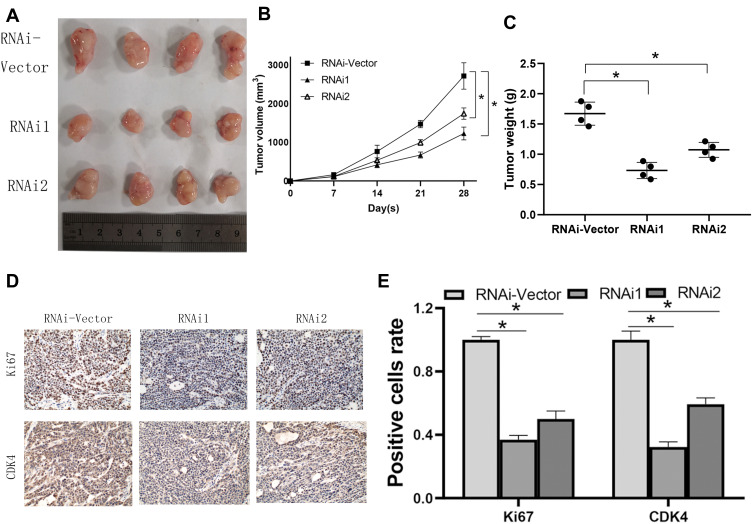
Figure 4.
NCAPG regulates the tumorigenesis in cardia adenocarcinoma (CA). (A) To detect the proliferative ability of CA cells, mice were subcutaneously injected with shRNA cells into the flanks. (B) The tumor size progression maps of the two groups of mice were analyzed after 4 weeks. *Indicates P < 0.05. (C) Weight of tumors in each group. *Indicates P < 0.05. (D, E) The Ki67 and CDK4 expression in mouse tumors were examined using immunohistochemistry. The mean ± SEM of three independent experiments was denoted using a bar. *Indicates P < 0.05.

