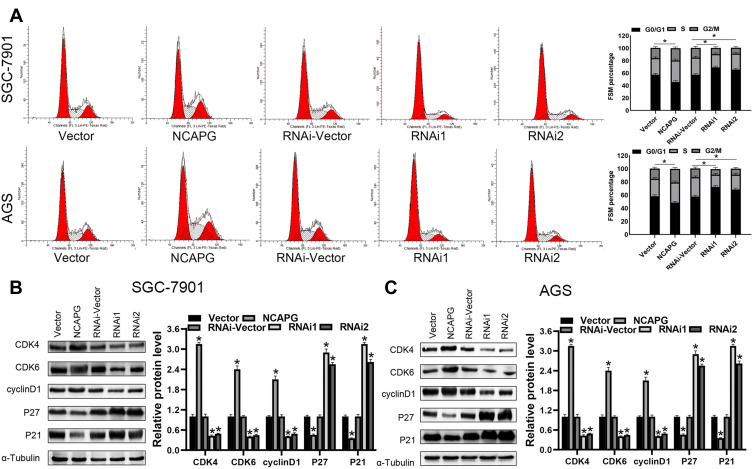
Figure 5.
NCAPG regulates cell proliferation and cell cycle G1 arrest. (A) The cell cycle analysis detects the representative image (left) and a summary bar graph (right). The values represent the mean ± SD of three independent experiments as per one-way ANOVA *P < 0.05. (B, C) Western blot analysis of CDK4, CDK6, cyclinD1, p21, and p27 expression in indicated cells. *Indicates P < 0.05.

