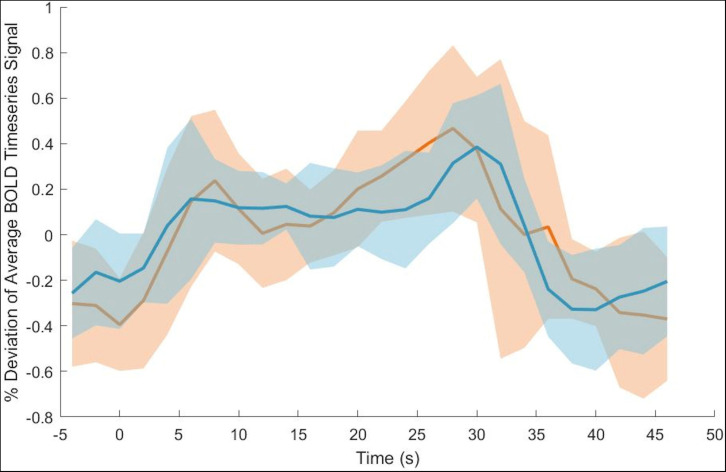
FIGURE 3.
Average across ROI voxels with subtracted mean BOLD signal intensity for baseline (orange) and endpoint (blue). Group level standard deviation plotted around timepoint BOLD signal intensity means. Time at 0 s represents the stimulus onset time. Note that the standard deviation is greater at baseline than endpoint.

