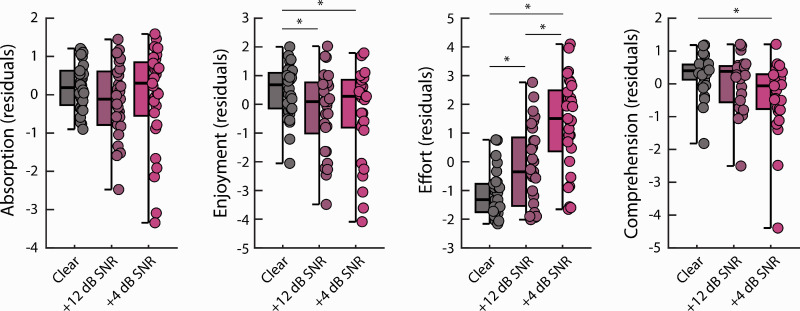
Figure 3.
Ratings of Absorption, Enjoyment, Effort, and Comprehension for Stories Presented Under Different Degrees of Acoustic Degradation (Experiment 2b). Data reflect the residuals after Nativeness (native vs. nonnative English speaker), Sex (female, male), and Age were regressed out. That is, separately for each dependent variable of interest, we calculated regressions using predictors Nativeness, Sex, and Age and plotted the resulting residuals here. Note that analyses using the original ratings yielded the same statistical results because these regressors were mostly nonsignificant (see text). Box plots are displayed, and dots reflect data from individual participants. Significant differences are indicated by an asterisk. *p ≤ .05.
SNR = signal-to-noise ratio.

