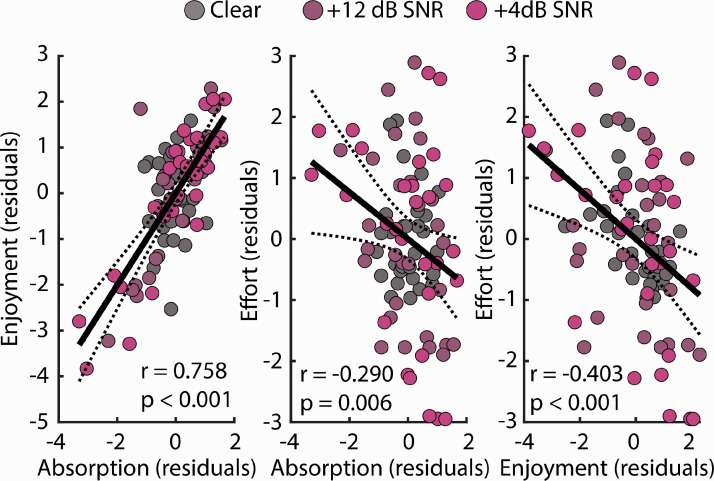
Figure 4.
Correlation Between Listening Experiences. Data reflect the residuals after regressing out Nativeness, Sex, and Age. That is, separately for each dependent variable of interest, we calculated regressions using predictors Nativeness, Sex, and Age and used the resulting residuals for the correlation plots. The solid line reflects the best fitting line. The dashed lines mark the 95% confidence intervals. All three correlations are significant, p < .05.
SNR = signal-to-noise ratio.

