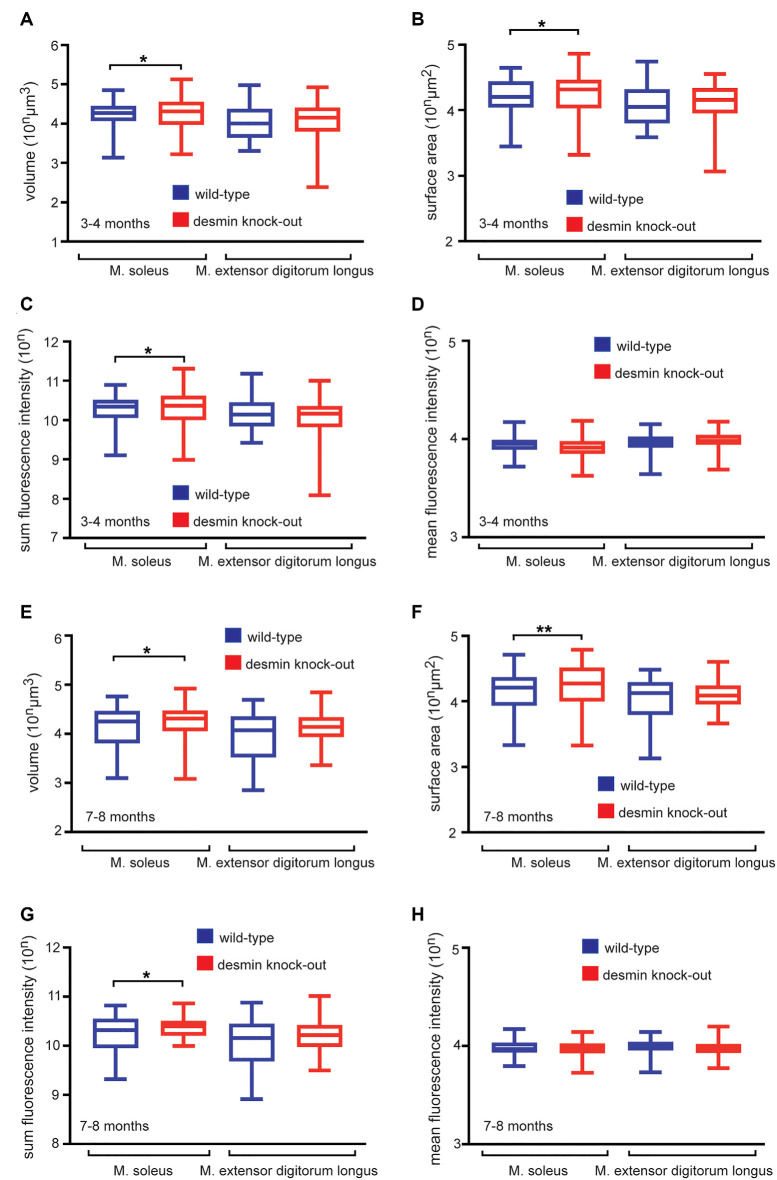
Figure 4.
Desmin knock-out mice display enlarged NMJs in soleus muscle. (A–D) Hindlimb muscles of 3–4 months old wild-type and homozygous desmin knock-out mice were dissected to stain fiber bundles with BTX. Imaging was done with a fluorescence microscope, and z-stacks were acquired for quantitative 3D morphometry. (A–D) Box and Whisker plots depict the recorded average volume, surface, and sum fluorescence intensity per NMJ of indicated genotypes and muscles. Note, surface, volume, and sum fluorescence intensity of NMJs are significantly higher in homozygous desmin knock-out mice in soleus muscle in comparison to wild-type littermates. For extensor digitorum longus muscle a total of 96 wild-types and 89 homozygous NMJs, for soleus muscle 90 wild-type and 103 homozygous NMJs were counted (n = 3 mouse pairs). Statistical significance was determined by unpaired two-tailed t-test (*P < 0.05). (E–H) Hindlimb muscles of 7–8 months old wild-type and homozygous desmin knock-out mice were dissected to stain fiber bundles with BTX. Imaging was done with a fluorescence microscope, and z-stacks were acquired for quantitative 3D morphometry. (E–H) Box and Whisker plots depict the recorded average volume, surface, and sum fluorescence intensity per NMJ of indicated genotypes and muscles. Note, surface, volume, and sum fluorescence intensity of NMJs are significantly higher in homozygous desmin knock-out mice in soleus muscle in comparison to the controls. For extensor digitorum longus muscle a total of 102 wild-types and 95 homozygous NMJs, for soleus muscle 99 wild-type and 102 homozygous NMJs were counted (n = 3 mouse pairs). Statistical significance was determined by unpaired two-tailed t-test (*P < 0.05, **P < 0.01).

