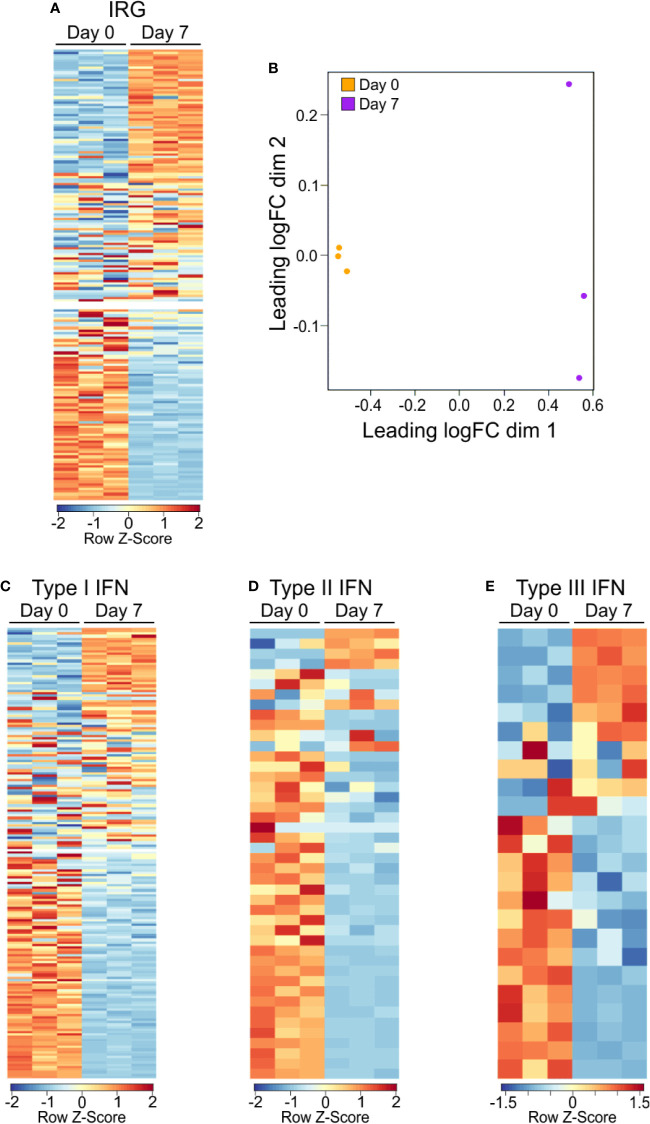
Figure 2.
Gene expression IRG signature of PSA exposed cells. (A) Heat map of interferon responsive genes from PSA exposed (D7) or unexposed (D0) CD4+ T cells. Values are row z-score. (B) Multidimensional scatterplot of IRG data comparison of PSA exposed and non-exposed cells (D7 in orange, D0 in purple). (C) Breakdown of IRG list into Type I, Type II, or Type III IFN categories.

