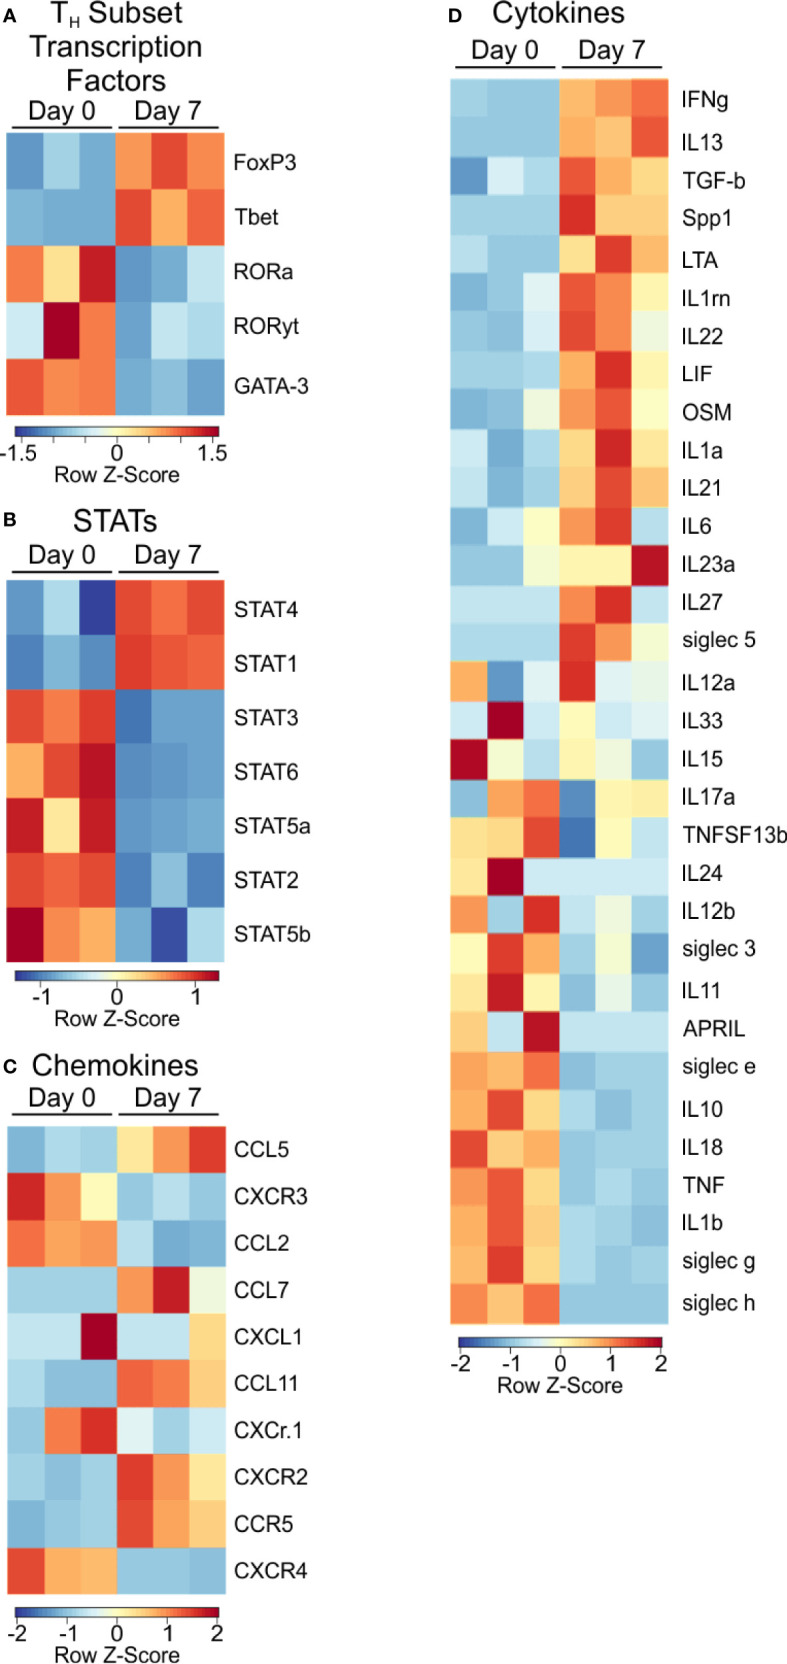
Figure 3.

Transcription factor and signaling molecule profile of PSA exposed cells. Heat map of (A) T subtype associated transcription factors, (B) STAT transcription factors, (C) Chemokines, and (D) Cytokines of PSA exposed T cells compared to control.
