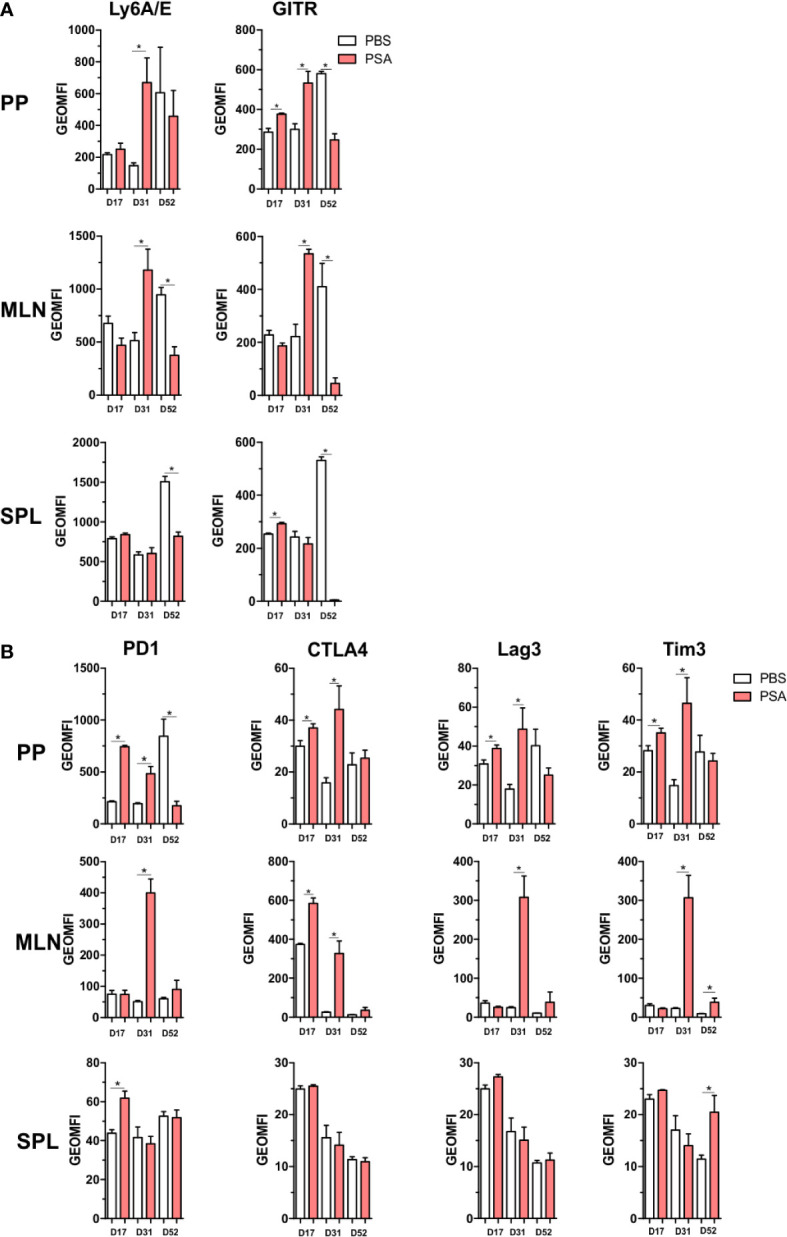
Figure 7.

Gut associated lymphoid tissue enrichment of PSA induced markers. Mice were orally gavaged with 100 µg of PSA dissolved in PBS every 72 h, 5 gavages total. Peyer’s patches, mesenteric lymph nodes and spleens were collected on D17, D31 or D52 after initial gavage. Data is geometric MFI. (A) In vivo activation marker expression across organs and time points. (B) Expression profile of immunomodulatory markers across organs and time points. (n = 3 mice per group, significance of P ≤ 0.05 = *).
