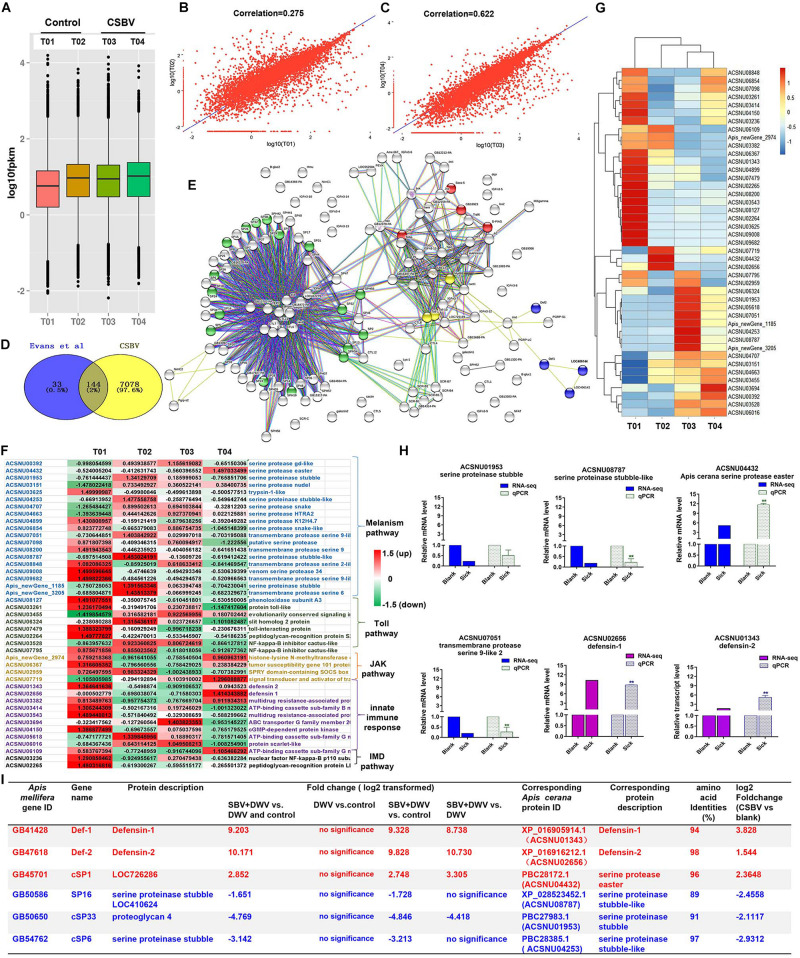
FIGURE 1.
Summary of the types and features of genes from different immune pathways. (A) The analysis of expression level of samples based on FPKM value. T01 and T02, T03 and T04 indicate control and CSBV-infected groups. (B) Correlation analysis of the expression of all mRNA between healthy groups and CSBV-infected groups (C). (D) The 144 differentially expressed immune genes were shared between our study and Evans et al. (2006) described. (E) The interaction network of 144 shared genes was predicted and found four major terms enriched (P < 0.05). Green, serine proteases and trypsin domain; red, Jak-STAT signaling pathway; blue, innate immune response; yellow, Toll receptor homology domain. (F) The analysis of the regulated genes related to serine proteases, melanization, and Toll pathway, Jak-STAT signaling pathway, innate immune response, and IMD pathway after CSBV infection. The values represent standardized expression levels based on FPKM mean values. Green and red indicate decreased and increased in expression levels, respectively. (G) Heat map of the regulated genes related to serine proteases, melanization, and Toll pathway, Jak-STAT signaling pathway, innate immune response, and IMD pathway. (H) The relative expression levels of serine proteinase and defensin genes from RNA-seq (T02, T03, and T04) and qPCR analyses. Actin was used as the internal reference gene. *P < 0.05, **P < 0.01. (I) The differentially expressed serine protease and defensin genes (*P < 0.05, FDR < 0.05) were compared with those of SBV-induced (Ryabov et al., 2016) (*P < 0.05, FDR < 0.05).

