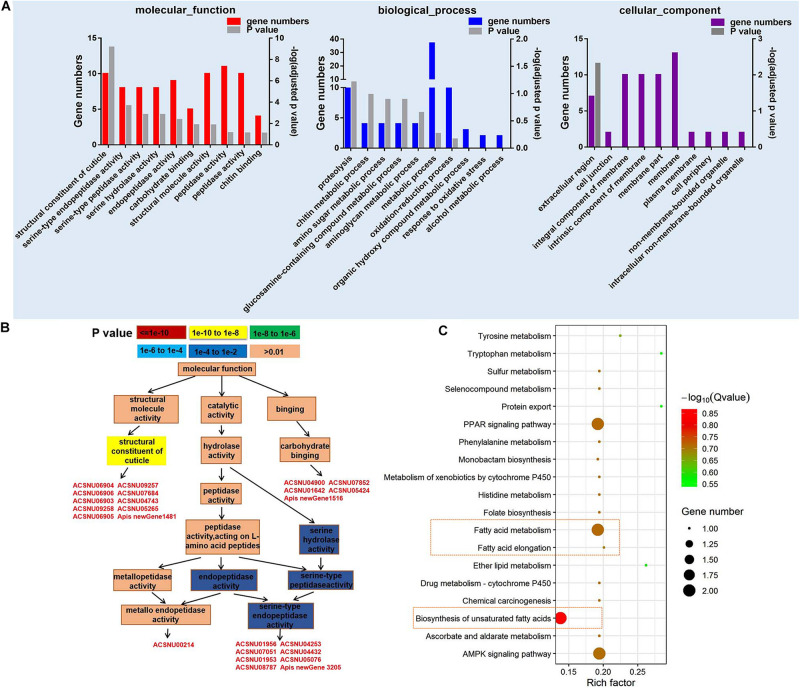
FIGURE 2.
GO and KEGG pathway enrichment analysis of differentially expressed genes (DEGs). (A) The top 10 GO terms of DEGs in molecular function, biological process, and cellular component (P < 0.05). (B) GO-directed acyclic graph indicates the term of molecular function. The color represents the significance levels in enrichment according to P-value. (C) The KEGG pathway enrichment analysis of DEGs (P < 0.05).

