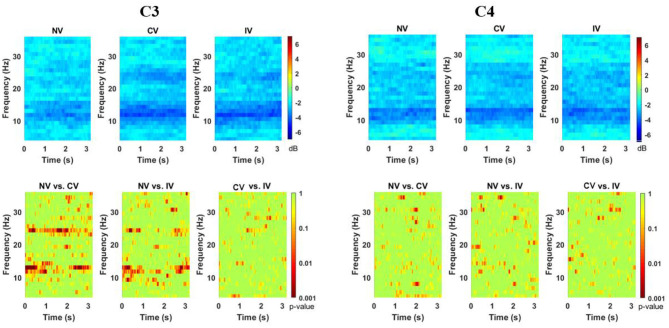
Figure 3.
Changes of ERSP over embodiment experience for corrected channel C3 and C4 under the three conditions. The ERSP values were averaged across subjects. The bottom row showed the map for the statistical tests (p-value for the post-hoc comparisons). There were two discriminative power patterns at C3 in the range from around 10–15 Hz and 22–26 Hz in C3 under CV and IV conditions. C3 represented the dominant hand area and C4 represented the non-dominant hand area. NV, no vibration; CV, continuous vibration; IV, intermittent vibration.

