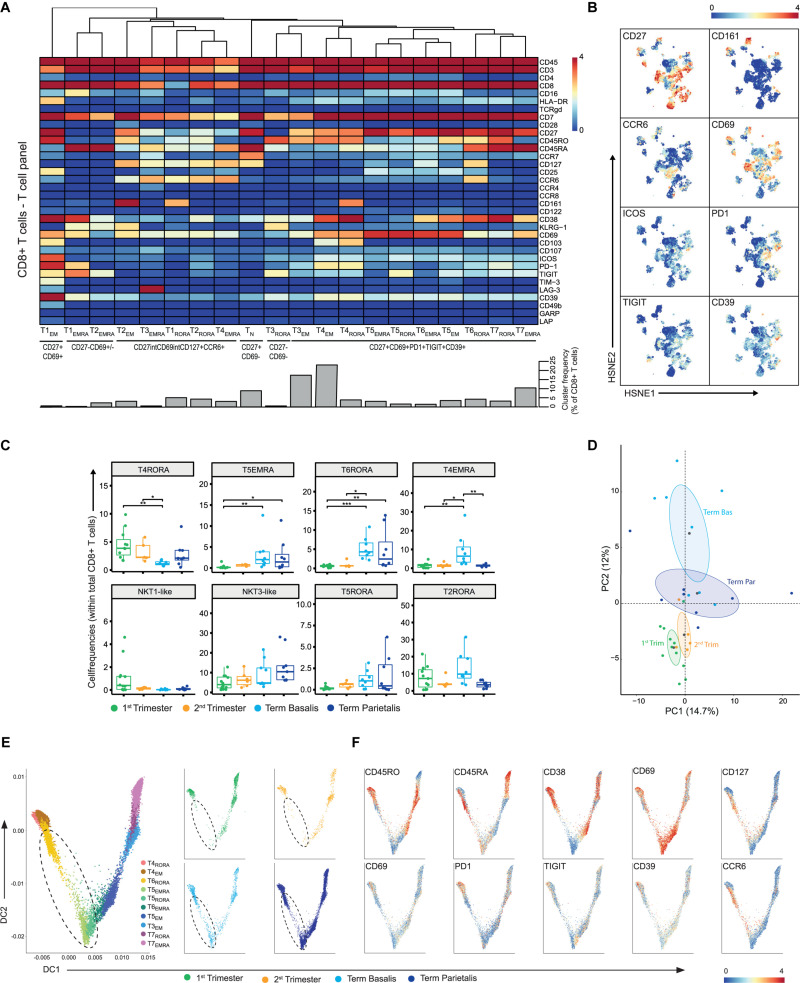
FIGURE 5.
In-depth characterization of the heterogeneity within the CD8+ T cell compartment. (A) Heatmap showing the marker expression values for the 20 identified CD8+ T cell clusters within the T cell panel (32 samples; 707,147 cells). Cluster IDs and cluster frequencies are displayed at the bottom of the heatmap. (B) First-level HSNE embedding of the expression values of the indicated markers. (C) Boxplots of sample frequencies, divided per trimester, of the clusters plotted as a fraction of total CD8+ T cells. The Kruskal-Wallis with Dunn’s test for multiple comparisons was performed. (D) PCA of the sample frequencies (as percentage of total CD8+ T cells) where the gestational age groups are depicted along the first two components. The centroid of each group is indicated in gray. (E) Visualization of TEMRA, TRORA, and TEM CD8+ T cell clusters in a diffusion map along two components. Each color in the left panel represents a cluster of cells. In the right panel, cells within the 1st trimester, 2nd trimester and term decidua basalis and parietalis are portrayed. (F) ArcSinh5-transformed expression values of the specified markers in the diffusion map. *P ≤ 0.05; **P ≤ 0.01; ***P ≤ 0.005.

