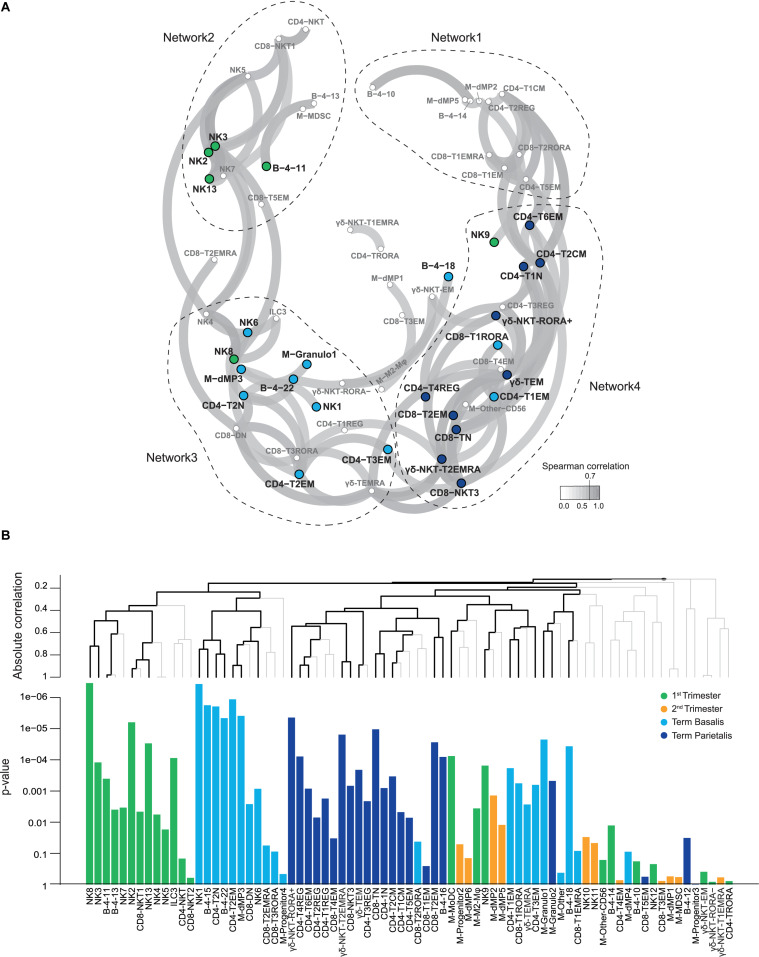
FIGURE 6.
Relationships between identified cell clusters from all major immune cell lineages. (A) Correlation network plot showing Spearman coefficients higher than 0.7 for relationships between the decidual immune cell clusters from the general panel. Every circle depicts an immune cell cluster, with colors corresponding to statistically significant contributions of clusters to 1st trimester, term decidua basalis or parietalis, as calculated by the global test (44). Higher correlation corresponds to greater proximity of cell clusters. (B) Multivariate associations between cell clusters detected by a multinomial logistic regression model with the global test. The top panel shows hierarchical clustering of absolute correlation distances, where the branches in black indicate significant multiplicity-corrected p-values. The bottom panel shows the corresponding p-values of immune cell clusters associated with 1st trimester (green), 2nd trimester (yellow), term decidua basalis (light blue), and parietalis (dark blue).

