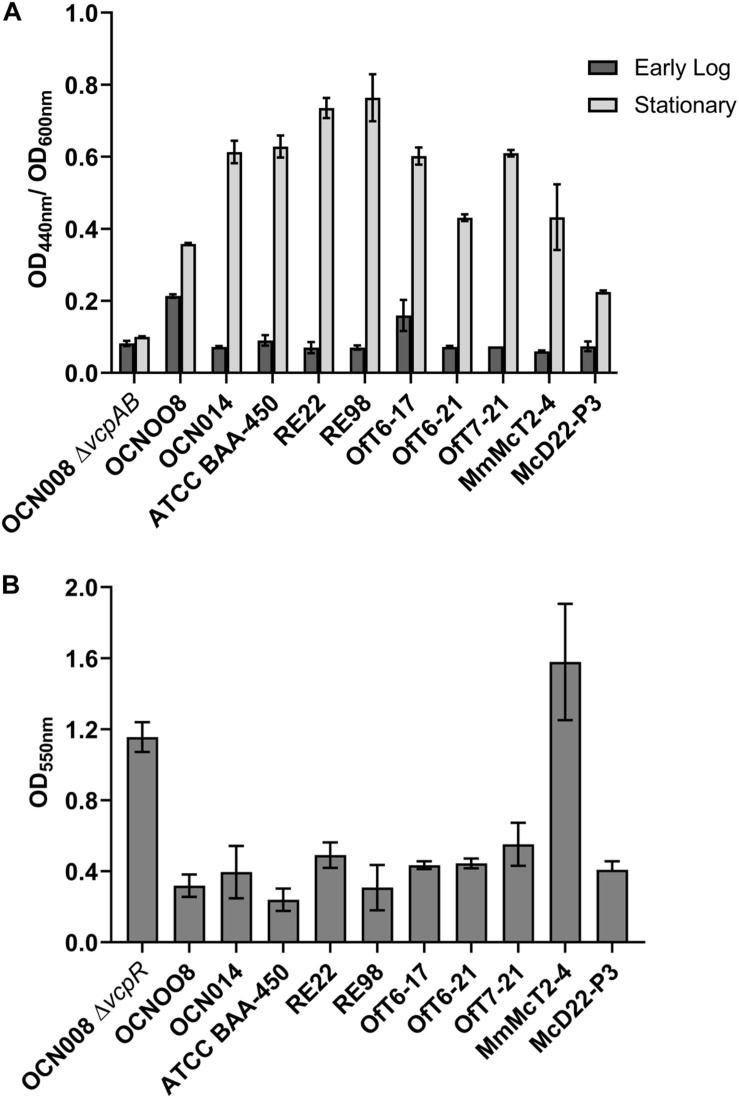
FIGURE 7.
Physiological comparison of Atlantic and Indo-Pacific V. coralliilyticus strains. (A) Azocasein assays with dark gray bars representing mean protease activity at early logarithmic cultures (OD600nm = 0.8) and light gray bars representing stationary phase (OD600nm = 3.0). All absorbance measurements taken at 440 nm were standardized to the culture density (OD600nm). The graph displays the mean of three replicates and bars represent the standard error of the mean. (B) Crystal violet extracellular polysaccharide (biofilm) assays. The graph displays the mean of four replicates and the bars represent the standard error of the mean.

