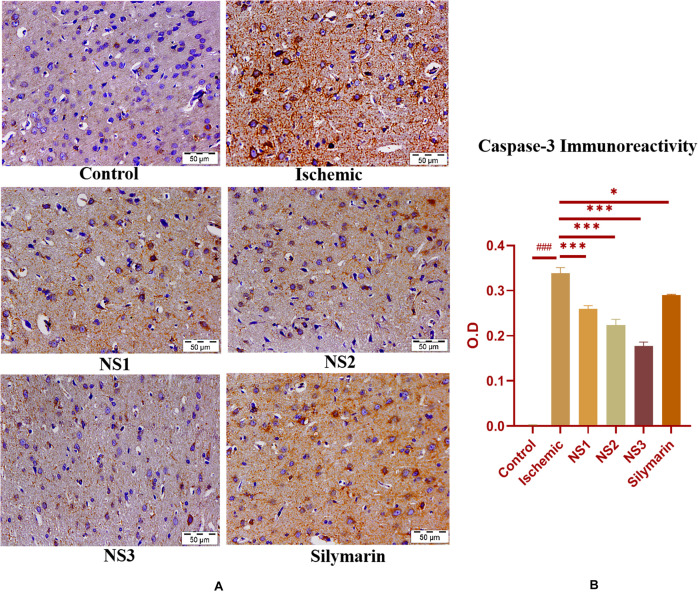
FIGURE 11.
(A) Photograph (40×) shows immunohistochemical expression of caspase-3 in the middle cerebral artery occlusion (MCAO) model in control (C), ischemic (I), and treatment groups of nanosilymarin doses NS1 (10 μg/kg b.wt), NS2 (100 μg/kg b.wt), NS3 (1,000 μg/kg b.wt), and free silymarin (Sil) (100 mg/kg b.wt). The control (C) group shows almost no expression for the caspase-3 marker, whereas the ischemic (I) group shows maximum expression. Treatments NS1 and NS2 showed moderate to mild expression but less than free silymarin; NS3 showed minimum expression. (B) Quantification of caspase-3 expression intensity as optical density (OD). The experiment was conducted for n = 3 data sets, and results are shown as mean ± SEM. Results on comparison with the control group showed a significant difference (###p < 0.001). Results obtained showed significant difference from the ischemic group (∗∗∗p < 0.001 and ∗p < 0.05).

