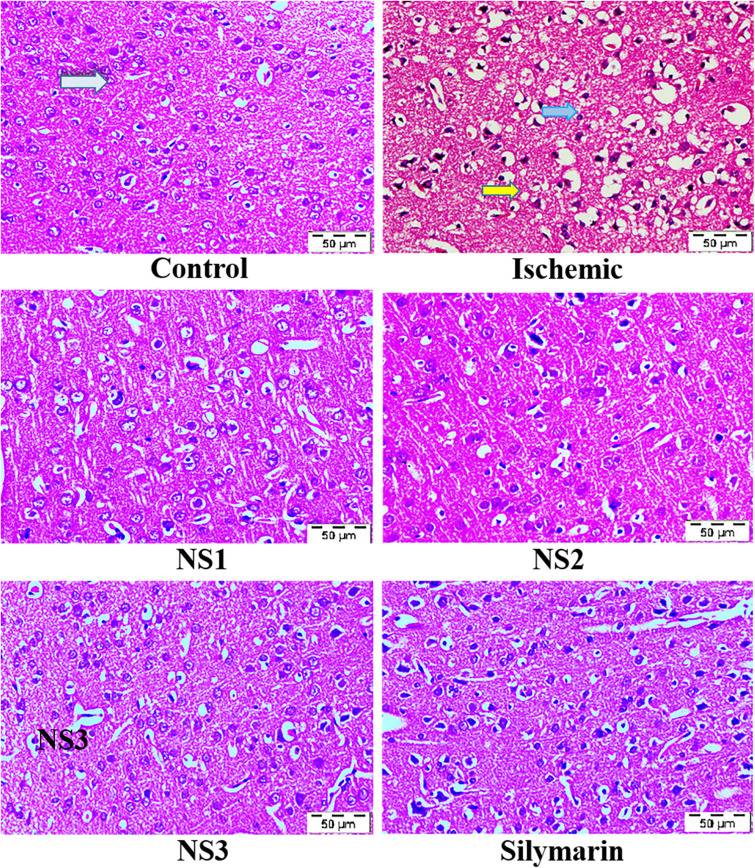
FIGURE 8.
Photographs showing histopathological changes (40×) in the cortex region for all the groups, i.e., control (C), ischemic (I), NS1 (10 μg/kg b.wt), NS2 (100 μg/kg b.wt), NS3 (1,000 μg/kg b.wt), and free silymarin (Sil) (100 mg/kg b.wt). The control (C) group showed intact neurons (light blue arrow) and normal morphology. In contrast, in the ischemic (I) group, degenerative changes like neuronal loss (yellow arrow), vacuolation (loss of intact neurons shown by the dark blue arrow), and altered morphology are visible. The NS1 treatment group showed decreased vacuolation and fewer morphological changes. These results are further improved in NS2 and NS3 when compared with the ischemic (I) and free silymarin treatment group.

