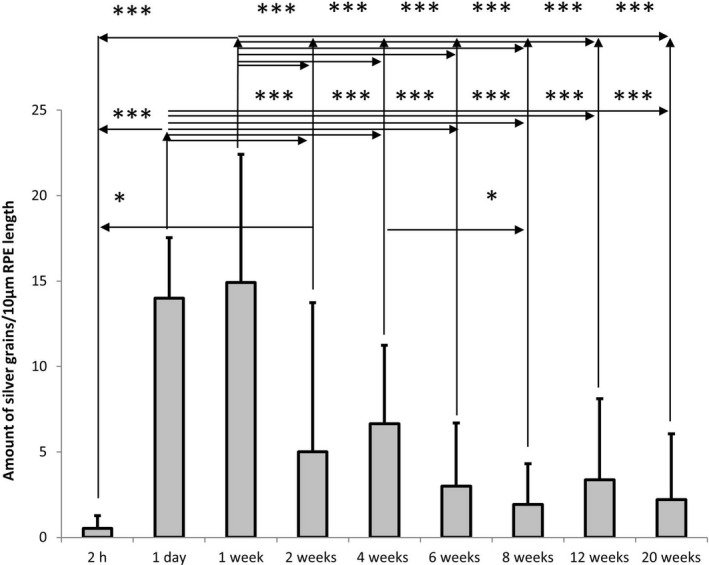
Figure 3.

Time course quantification of silver grains within the cytoplasm of RPE cells at a length of 10 µm indicating the amount of radioactive labeled remofuscin in the RPE of pigmented Abca4‐/‐ mice, shown as mean and standard deviation plots. Electron micrographs (4‐40 digital images per section) of comparable sections of the RPE (12.000 x magnification) were taken. The results of an ANOVA analysis with Tukey post hoc test are shown: * for P < .05, *** for P < .0001
