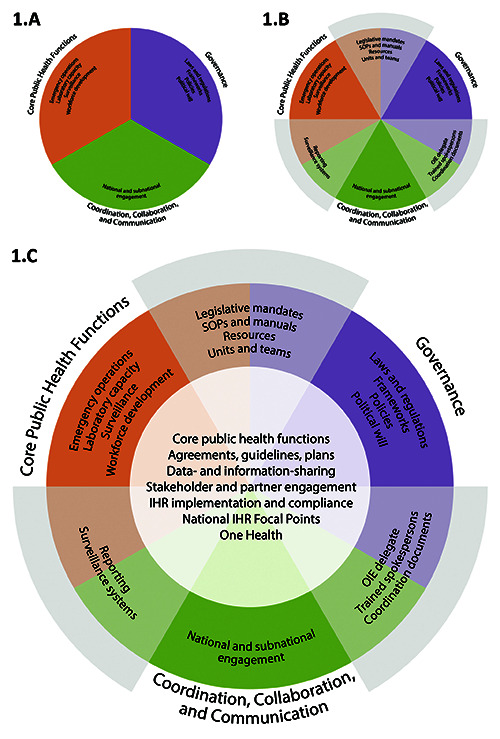
Figure 1.

The conceptual map in 1.A-1.C is a stepwise presentation of results, displaying the overlapping subthemes within thematic areas and their interlinkages, as seen in the NPHI subset and larger data set. 1.A presents the three identified thematic areas, 1.B adds the interlinkage of two thematic areas, and 1.C adds the interlinkage of all three thematic areas.
