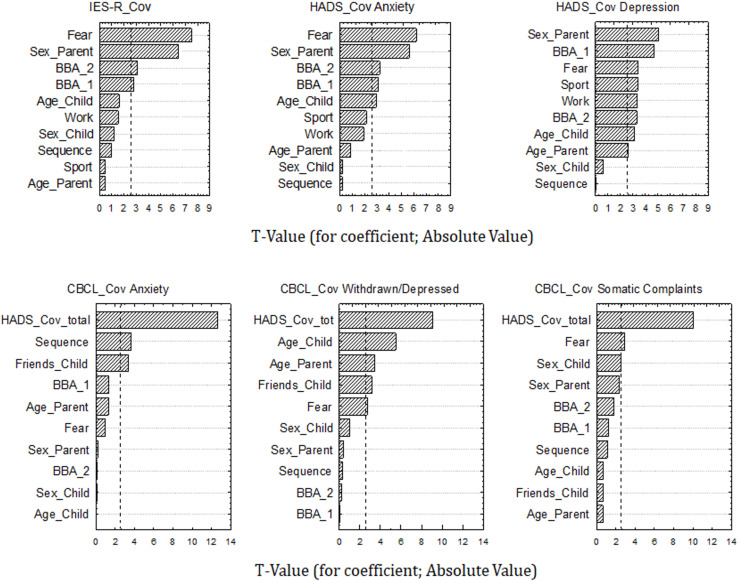
FIGURE 1.
Chart of t-values for multiple regression coefficients. X-axis refers to t-values (absolute values), y-axis refers to variables considered in each regression model [Sex and age of Parents and Children; parents’ employment status –Work-; Fear of contagion; amount of sport practiced; the order with which HADS and CBCL questionnaire were compiled by parents: Sequence PreCov_Cov or Sequence Cov_PreCov; number of children’s close friends; parents’ total HADS_Cov score; and parents’ “broadening of biased attention” on the pandemic crisis by thinking about its possible secondary positive effects for one’s life (BBA_1) and for the environment (BBA_2)]. Vertical bar in each graph indicates significance level at p < 0.01. IES-R, Impact of Event Scale-Revised; HADS, Hospital Anxiety and Depression Scale; CBCL, Child Behavior Checklist. Cov, completion of questionnaires with reference to the Covid-19 health emergency.

