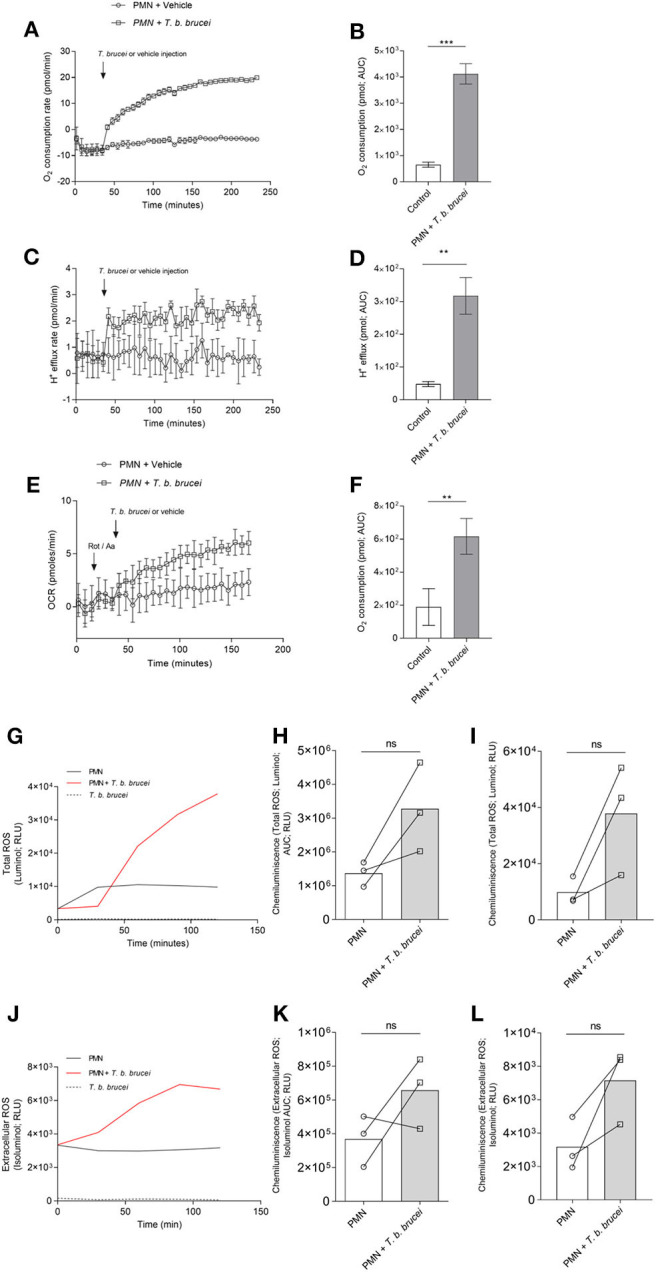
Figure 1.

T. b. brucei-induced metabolic changes in exposed bovine PMN. Activation of PMN was monitored by an extracellular flux analyzer (Seahorse) for oxygen consumption rate (OCR) proton efflux rate (PER). PMN were incubated in XF RPMI media for 45 min without CO2 and then alive T. b. brucei trypomastigotes or vehicle was injected at the time point indicated by arrows. The increase in OCR (A) and PER (C) was monitored for 232 min. The area under the curve (AUC) was calculated for all registries and plotted as mean ± SD (B,D; n = 3) showing the increase in both parameters for activated PMN. In a slightly different set-up, rotenone/antimycin A was injected before the addition of T. b. brucei to inhibit mitochondrial activity (E,F; n = 5) **p > 0.01, ***p > 0.001 compared with injection of vehicle. Also, total ROS production (G) and extracellular superoxide (J) was evaluated by the use of luminol and isoluminol, respectively. Both reactive oxygen species increased during the experiment, and the AUC was calculated and represented as mean ± SD. In this case, statistical analysis shows no differences when compared with the control condition (H,K; n = 3). A similar result is obtained when the luminescence values at 120 min (final reading) are analyzed (I,L).
