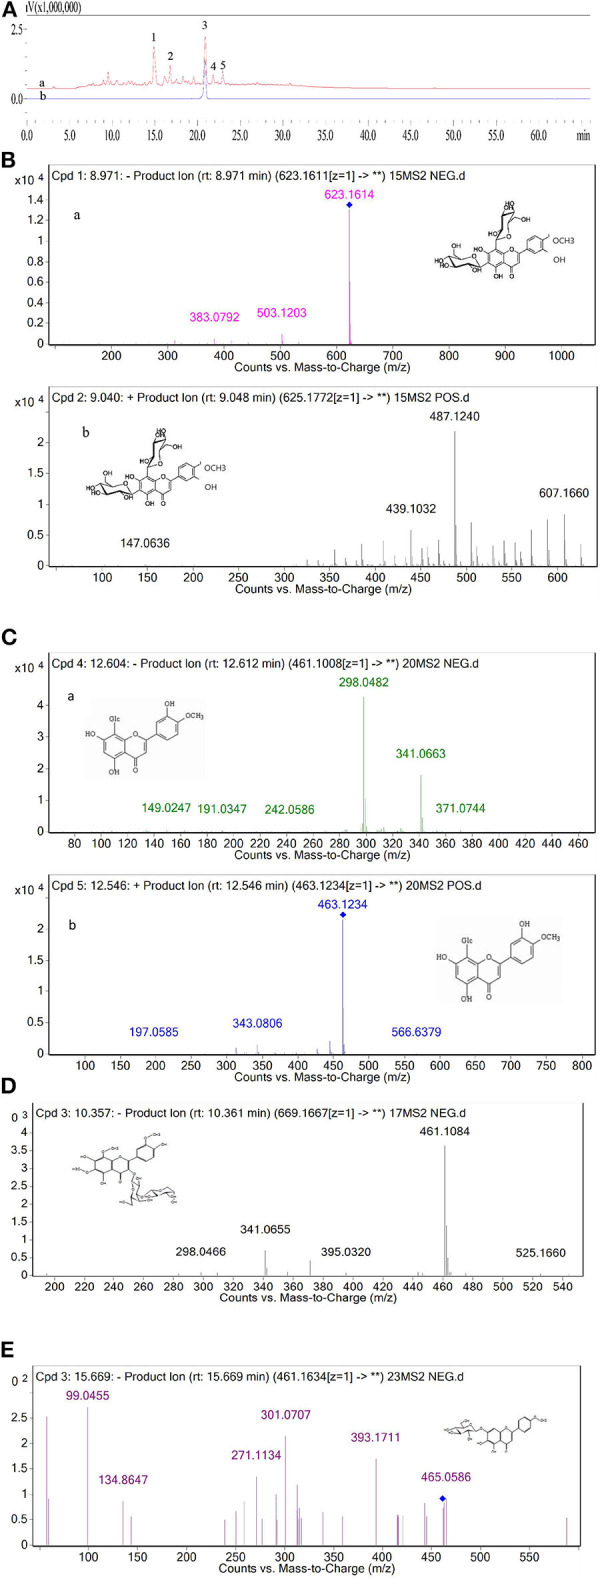
Figure 1.

(A) HPLC chromatogram of the purified FFC detected at 280 nm (a) and hesperidin standard detected at 280 nm (b). (B) The MS/MS of peak 1 in negative ionization (a) and positive ionization (b). (C) The MS/MS of peak 4 in negative ionization (a) and positive ionization (b). (D) The MS/MS of peak 2 in negative ionization. (E) The MS/MS of peak 5 in negative ionization.
