
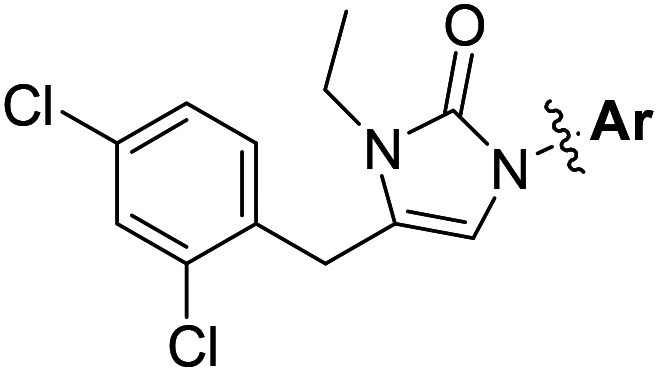
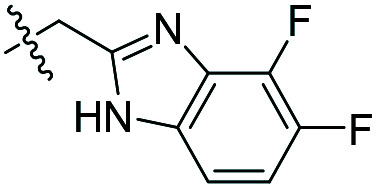
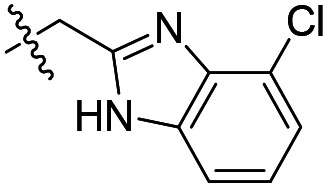
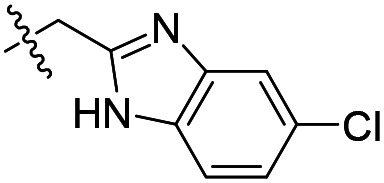
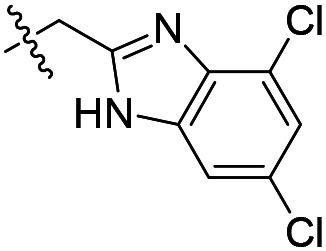
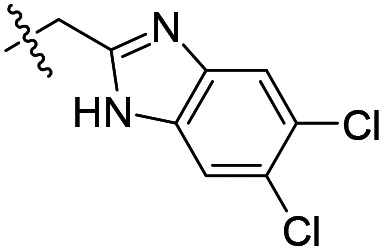
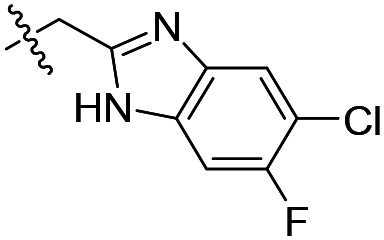
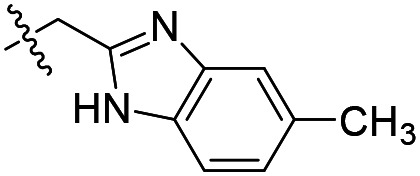
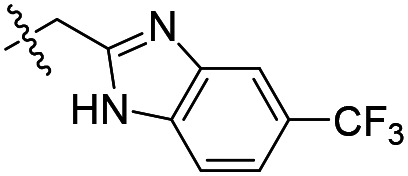
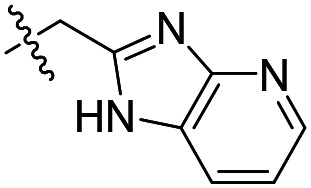
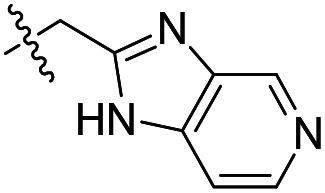
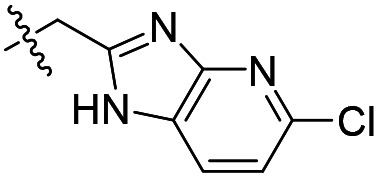
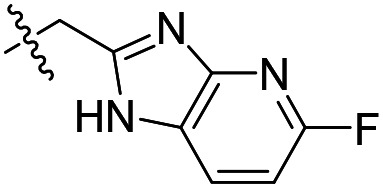
Table 1. Structures and associated in vitro testing results for N-ethyl substituted analogs of compound 1.
| ||||
| Compound number | Ar | T. brucei a EC50 (nM) | CRL-8155 b CC50 (nM) | HepG2 c CC50 (nM) |
| 2 |
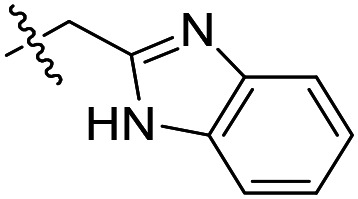
|
40 | >50 000 | >50 000 |
| 3 |
|
>2000 | >50 000 | >50 000 |
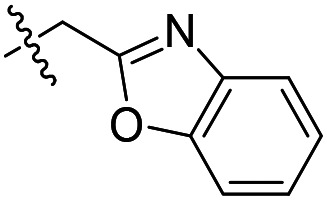
| 4 |
|
31 ± 4 (n = 2) | 45 000 | >50 000 |
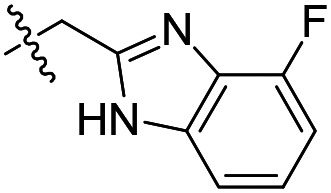
| 5 |
|
26 ± 3 (n = 4) | 41 000 | 40 600 |
| 6 |
|
210 | >50 000 | >50 000 |
| 7 |
|
69 | 27 100 | 45 300 |
| 8 |
|
1600 | 38 200 | 43 700 |
| 9 |
|
660 | 31 600 | 31 300 |
| 10 |
|
220 | 20 900 | 29 800 |
| 11 |
|
110 | >50 000 | >50 000 |
| 12 |
|
>2000 | >50 000 | >50 000 |
| 13 |
|
17 ± 3 (n = 2) | >50 000 | >50 000 |
| 14 |
|
390 | >50 000 | >50 000 |
| 15 |
|
1.6 ± 0.2 (n = 5) | >50 000 | >50 000 |
| 16 |
|
3.4 ± 0.1 (n = 3) | >50 000 | >50 000 |
aControl for T brucei EC50 assay average ± SEM: pentamidine (1.7 ± 0.2 nM; n = 14). Compounds with initial EC50 < 30 nM were tested more than once and their EC50s are shown as average ± SEM (number of tests).
bControl for CRL-8155 CC50 assay average ± SEM: quinacrine (7.0 ± 3.7 μM; n = 3).
cControl for HepG2 CC50 assay average ± SEM: quinacrine (7.6 ± 0.9 μM; n = 5).