Figure 1.
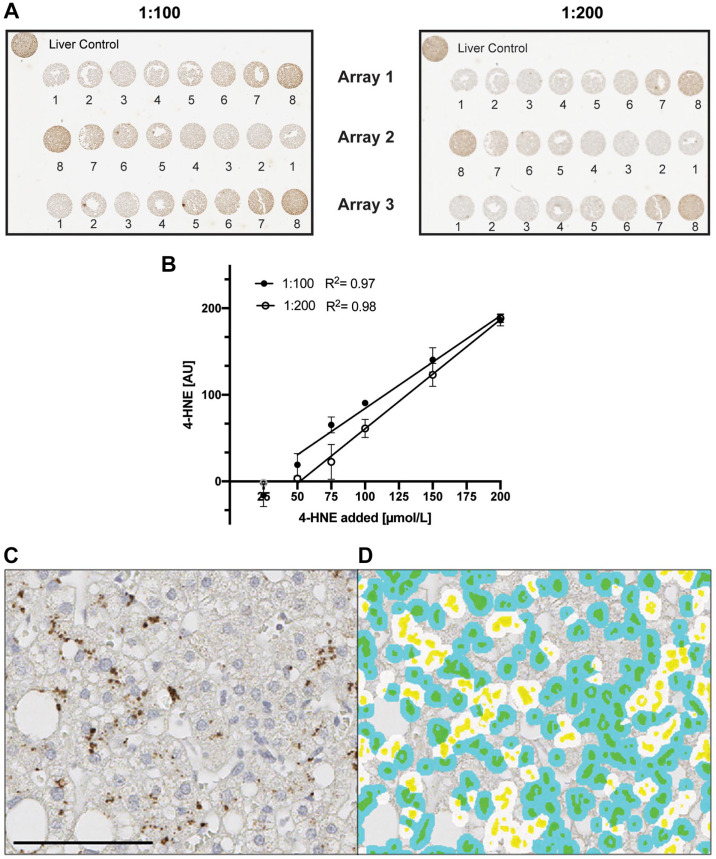
Calibration curves of cells treated with 4-HNE. Hep G2 cells treated with different doses of 4-HNE (1 = media, 2 = 0, 3 = 25, 4 = 50, 5 = 75, 6 = 100, 7 = 150, 8 = 200 µmol/l) were incubated with mouse monoclonal [HNEJ-2] at either 1:100 (filled circle, 1 µg/ml) or 1:200 (empty circle, 2 µg/ml) dilution for 1 hr at room temperature. (A) Shows three individual arrays for both dilutions. Background staining of the solvent control (0 µmol/l) was subtracted from all points. In the linear regression, 25 µmol/l was excluded for both dilutions as it did not differ from the background staining (B). Slopes were 1.071 (1:100) and 1.262 (1:200) while Y intercepts were -22.84 (1:100) and -65.44 (1:200), respectively. Quantification was performed using Visiopharm software. Data are shown as mean ± SD. Fig. 1C shows a representative image of 4-HNE staining in human liver with the corresponding image analysis (1D). Cytoplasmic 4-HNE was quantified and cells were classified as positive cells (white-colored spots) or negative cells (blue-colored spots). Yellow marks nuclei and green represents the combination of blue and yellow. Data are shown as mean ± SD. Scale bar, 100 µm. Abbreviations: 4-HNE, 4-hydroxynoneal; HNEJ-2, mouse monoclonal anti-4 hydroxynonenal antibody.

