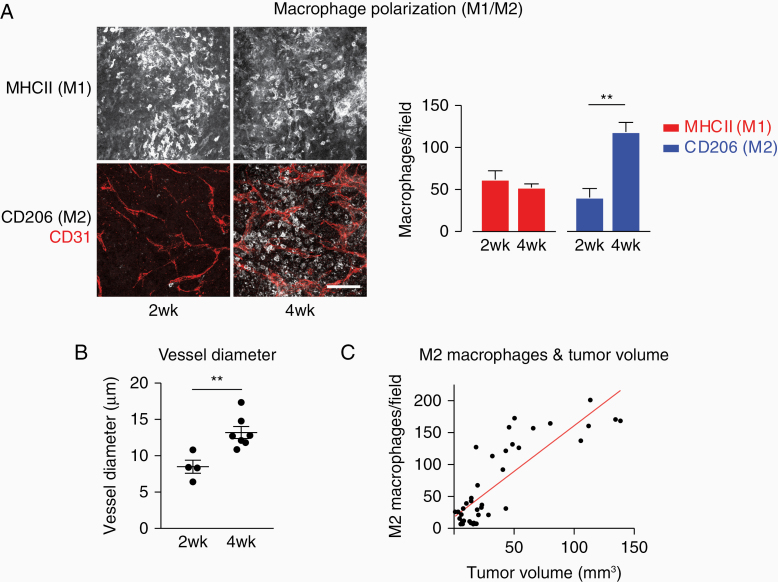
Figure 1.
TAMs switch from M1 to M2 polarization during tumor growth with increasing tumor size. (A) Immunofluorescent staining of sections at 2 and 4 weeks of tumor growth. Scale bar: 100 µm; 50 µm z-stack. Quantification of M1- and M2-positive macrophages per field of view in 2 and 4 weeks tumors. N = 7 (2 weeks) and 7 tumors (4 weeks); 5 fields of view/tumor. ** P < .01. (B) Blood vessel diameters in 2 and 4 weeks tumors. **P < .01. (C) The number of M2 macrophages correlates with tumor size. Each dot represents 1 tumor, the red line indicates the linear relationship of tumor volume and M2 macrophages. Spearman’s rank correlation coefficient: 0.78; P < .0001. Data shown: mean + standard error of the mean (A and B).

