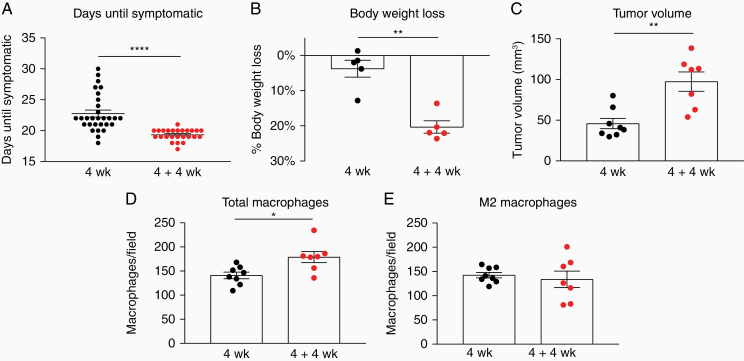
Figure 6.
Secondary tumors display more aggressive growth than primary. (A) Days of primary and secondary tumor growth until symptoms of tumor burden are observed. N = 30 (4 weeks) and 25 (4 + 4 weeks) animals. ****P < .0001. (B) Percentage of body weight loss in mice bearing primary or secondary tumors as measured at humane end-point. **P < .01. (C) Tumor volume of primary and secondary tumors. **P < .01. (D) F4/80+ macrophages in primary and secondary tumors. *P < .05. (E) Number of M2 (CD206+) macrophages in primary and secondary tumors. Each dot represents 1 mouse/tumor (A–E). Data shown as mean ± SEM (A–E).

