. 2020 Jun 8;11(7):823–832. doi: 10.1039/d0md00137f

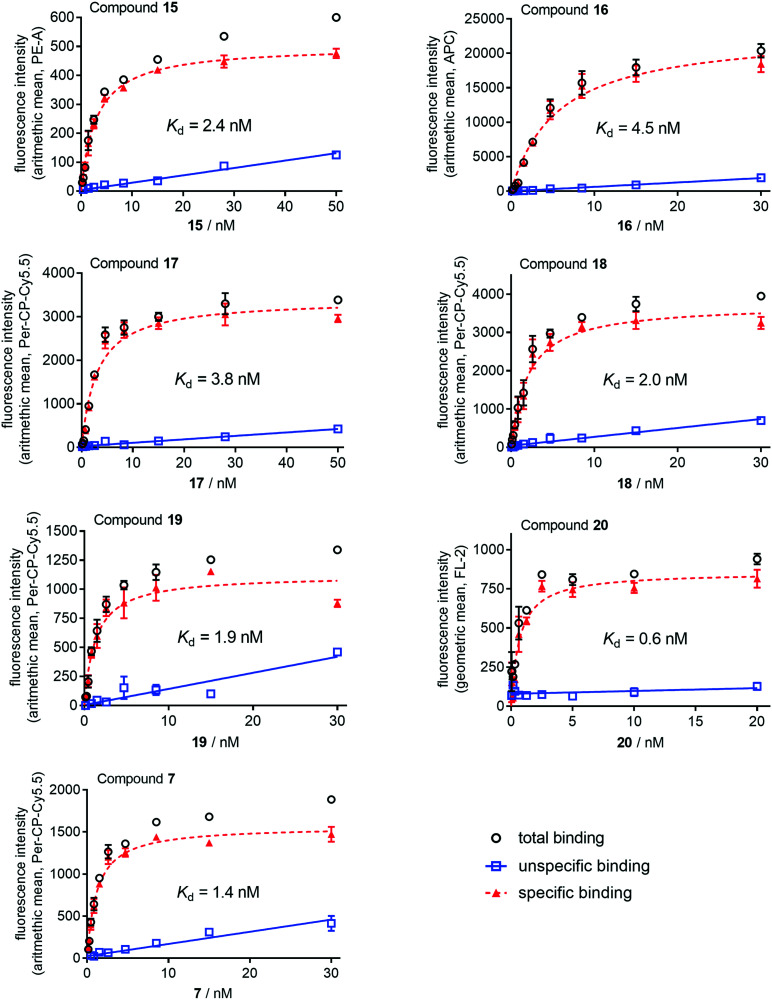
Fig. 4. Representative saturation isotherms (specific binding, dashed line) obtained from flow cytometric saturation binding experiments performed with 7 and 15–20 at intact CHO–hM2R cells. Unspecific binding was determined in the presence of atropine (21, for structure see Fig. S4, ESI) used in 500- or 1000-fold excess. Cells were incubated with the fluorescent ligands at 22 °C in the dark for 2 h. Experiments were performed in duplicate. Measurements were performed on a FACSCantoII (7, 15–19) or a FACSCalibur (20) flow cytometer (Becton Dickinson). Used laser lines/emission filters: 15, 488 nm/585 ± 21 nm (PE channel); 16, 488 nm/660 ± 10 nm (APC channel); 7 and 17–19, 488 nm/670 ± 65 nm (PerCP–Cy5 channel); 20, 488 nm/585 ± 21 nm (channel FL-2). Data represent mean values ± SEM (total and unspecific binding) or calculated values ± propagated error (specific binding). Note: total and unspecific binding data represent autofluorescence-corrected data.

Fig. 4