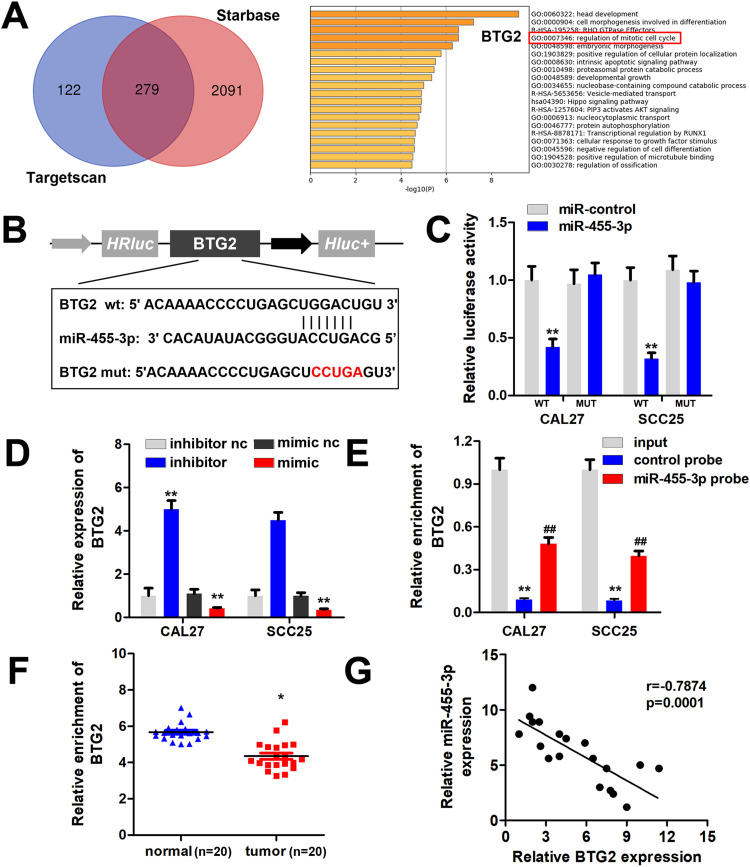
Figure 5.
miR-455-3p targets BTG2 in OSCC cells. (A) Bioinformatics analysis based on the TargetScan and Starbase database was performed to screen the targets of miR-455-3p. Enrichment analysis of these 279 potential target genes was performed using Metaspace software. (B) The binding site between miR-455-3p and BTG2 was showed. (C) Luciferase assay was carried out to verify the combination of miR-455-3p and BTG2. (D) qPCR was used to assess the BTG2 expression in each group. (E) RNA pulled down experiments was performed to confirm the interaction between miR-455-3p and BTG2. (F) qPCR was used to assess the expression level BTG2 in OSCC tissues. (G) Pearson analysis was performed to evaluate the correlation between miR-455-3p and BTG2 expression level. *P<0.05, **P<0.01, ##P<0.01.

