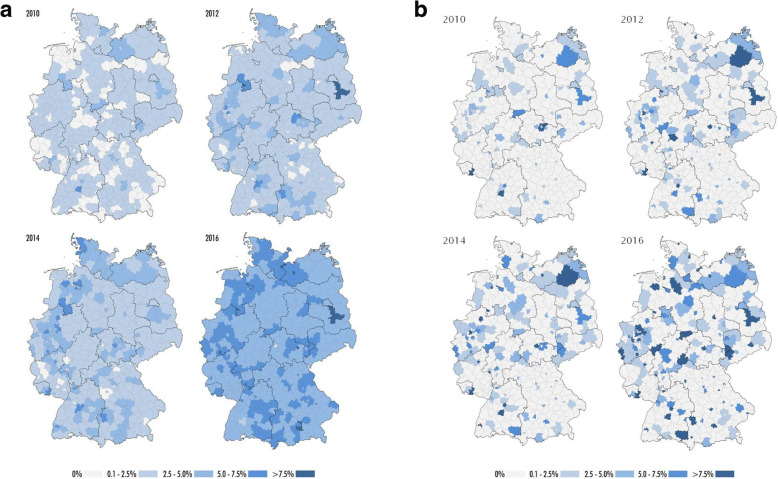
Fig. 4.
a Maps of temporal and regional evolution of mechanical thrombectomy rates in Germany from 2010 to 2016 according to places of residence of the patients. b Maps of temporal and regional evolution of mechanical thrombectomy rates in Germany from 2010 to 2016 according to places of treatment in hospital

